How to Make an Infographic in PowerPoint: The Beginners’ Guide
A beginner-friendly tutorial that covers the basics of how to create an infographic in PowerPoint.
- Share on Facebook
- Share on Twitter
By Iveta Pavlova
in How-To Tutorials
5 years ago
Viewed 49,638 times
Spread the word about this article:

Today, we’ll be talking about how to make an infographic in PowerPoint and it’s way easier than you think!
Why choose PowerPoint for your next infographic? Microsoft’s popular software for presentations is loaded with so many features and design tools that in fact, it includes everything you need in order to make an infographic in PowerPoint. Moreover, you probably already have it installed on your PC and are familiar with its interface.
For the purpose of this tutorial, we’ll assume that you have set your topic, gathered your content, and have established the structure of the infographic you’ll be making. If you need insight on this part of preparing your infographic, take a look at our in-depth guide on how to make an infographic . Now, let’s begin!

Size & dimensions
The first step is to prepare your canvas. Unlike presentations which are usually designed in 4:3 or 16:9 horizontal layouts, most infographics are vertical. This means that the first thing to do is change the layout and adjust the size of your infographic.

Now, the size of your infographic depends on the volume of information you need to visualize. It also depends on where you are going to publish it: on your blog, on social media channels, as a printed poster, etc.
For social media channels, a width of 600px is enough in terms of readability. If you are making the infographic for Pinterest, have in mind that the maximum preview size of a pin is 1:2.1 aspect ratio (e.g. 600 x 1260 px), and for other social media channels it’s even less. However, our recommendation is to make your infographic in retina size, i.e. twice this width.
Related: How to Design Awesome Graphics For Social Media
Now, back to PowerPoint. Go to Design tab > Slide Size > Custom Slide Size. We set our infographic to a 1:4 aspect ratio. You could make it 1:1, 1:2, 1:2.5, etc. depending on your needs. Note that resizing the canvas in PowerPoint is a little tricky. From our experience, it is better to ensure a bigger length and cut it off later.
In our case, we set the sizes to 12.5 x 50 inches (1200 x 4800 pixels) retina size. You could use half these dimensions for a non-retina design – 6.25 x 25 inches (600 x 2400 pixels). Regarding Maximize or Ensure Fit window, you don’t have any content for the moment, so just click one of the two options.

The next step is to clear up the default title and subtitle placeholders. Go to Home > Layout > and choose Blank , or simply click on each of them and press Delete . Your canvas should look like this:

Rulers, Gridlines, and Guides
Turn rulers, gridlines, and guides on to align your design elements, achieve symmetry (or asymmetry – depending on what you aim for). These tools will help you design a precise and aesthetically pleasing infographic. Go to View and check Rulers , Gridlines , and Guides.
If you need to make adjustments, click on the little arrow icon in the lower right corner to open Grid and Guides pop-up window with settings.

The background of your infographic can remain white but if you’d like, you can change it via Design > Format Background. Choose among a solid fill, gradient fill, picture, texture, or a pattern fill. In our case, we picked a light blue color.

Let’s start building the design. You can easily create the header section of your infographic by using PowerPoint’s shapes. Go to Insert > Shapes and choose the Rectangle shape. Once you place the shape, you’ll see all the design settings that appear.

Once you’ve adjusted the shape (you can change the colors and style later), start typing your text. Play with the fonts and sizes to achieve a cool effect. You can also combine two fonts, e.g. serif and sans serif fonts, handletter fonts and typewriter fonts, and more combinations. Just make sure to keep the aesthetic of the design.

Of course, you can experiment with font colors and make color combinations. Have in mind that the colors you choose determine how your viewers will perceive the information. Make sure that:
- the colors you use are in harmony with the topic of your infographic;
- convey the right emotions;
- do not deviate from your brand identity.

You may also be interested in How to Add Audio to PowerPoint: Quick Step-by-Step Guide
Building the infographic body
By using PowerPoint’s library of shapes, you can create various interesting designs for the body of your infographic. For this tutorial, we decided to add a little bit of depth. We’ve used 3 different shapes to recreate a 3D effect and an arrow pointing down:
- a trapezoid in a lighter blue color to recreate depth;
- a rectangle in the same blue color as the one used for the header section;
- an isosceles triangle to be used as the tip of the arrow.

For the triangle, use the same tone of blue for a fill color as the rectangle above in order to complete the design of the arrow. The next step would be to add more design elements and start distributing your content.
If you decide to break your content into steps, here is an idea of how to do it. We’ve used the built-in shapes in PowerPoint to create design elements to position the texts for each element. You can add shadows to elements via Format Shape to make these fields “float” over the arrow.

Once you decide how to position your elements, start typing your text. To make the sections look like steps, we’ve added big numbers. Make sure to align the text inside, so it doesn’t go under the numbers.

Adding icons
No matter of your design, you will probably need to use icons at some point. Icons support your message and make content easier to understand. One way to do this is to use PowerPoint’s library of icons at Insert > Icons.
Once inserted, you can easily position the icons in your design. Resize them as much as you need. Don’t worry, they work like vectors, so they won’t lose quality. Changing colors is also easy. We used the same nuance of yellow as the one we used for the numbers.
Another way to add icons to your infographic design is to import custom icons as vector graphics via Insert > Pictures . The latest version of PowerPoint supports the vector file format SVG which is the recommended file format for imported icons. They are light, easy to edit and won’t lose quality when resized.
Adding data visualization elements
In PowerPoint, you can easily add graphs, charts, and other design elements for visualizing your data by using SmartArt. Go to Insert > SmartArt and you will find that there are several categories of data visualization graphics: list, process, cycle, hierarchy, and more.

The variety of graphs is large and the options for editing are many. From the design panel, you will find different styles and color schemes to apply to the graph. Also, you can easily delete parts of the graph, change shapes, add shapes, add text and more editing options, so that it matches your design just the way you imagine it.

You can also add custom graphic templates for data visualization. The file format accepted by PowerPoint is EMF and it gets transformed into a fully editable vector shape. Unfortunately, PowerPoint no longer supports the most popular vector file format EPS. This means:
- you will either have to use an EPS-to-EMF converter (we recommend this one );
- or if you can work with vector-based software, export the graphics in EMF file format.
Simply drag and drop the image file into the canvas in PowerPoint and the software will place it onto your design. To make it fully editable, right-click with the mouse and choose Group > Ungroup.

Then, PowerPoint will ask you to convert the image into a drawing object. Click Yes .

Now the graphic is fully editable. You can change sizes of elements, text, colors, and delete elements if you have to. In the example below, we deleted the background and changed the colors of one of the design elements. You can easily make any kinds of edits.

Once you are ready with positioning your elements, don’t forget to add a footer where to cite all the sources you’ve used. You can easily create the footer by adding a rectangle shape just like you did for the header or jazz it up with a more unconventional form like we did.

And that’s about it! These are the basics you need to know when it comes to creating the design of your infographic in PowerPoint. All that’s left for you is experiment and try different looks until you are happy with the design.
Exporting the final design
It’s easy to save the final infographic design into an image file. Simply go to Save As and choose your preferred option from the dropdown menu. We recommend PNG or JPG file formats. Then, PowerPoint will ask you if you want to export all slides or just this one. Select Just This One and voila!

Now go share it with the world!
We are really curious to see the designs you’ve come up with. Come on and share with us your creations in the comments below.
Hopefully, we helped you understand the basics of creating an infographic in PowerPoint. The software is really loaded with amazing tools and resources to help you create beautiful designs. If you’d like to dig deeper into the subject of creating infographics, have a look at How to Make an Engaging Infographic: The Full Guide . See ya!

Add some character to your visuals
Cartoon Characters, Design Bundles, Illustrations, Backgrounds and more...
Like us on Facebook
Subscribe to our newsletter
Be the first to know what’s new in the world of graphic design and illustrations.
- [email protected]
Browse High Quality Vector Graphics
E.g.: businessman, lion, girl…
Related Articles
What is google slides and how to get started, how to write a killer blog post in 10 easy steps, how to create a character profile for your brand mascot [+ free character design template], 25 affinity designer tutorials to step up your game in 2022, brief guide to choose right logo for your brand, 500+ free and paid powerpoint infographic templates:, enjoyed this article.
Don’t forget to share!
- Comments (2)

Iveta Pavlova
Iveta is a passionate writer at GraphicMama who has been writing for the brand ever since the blog was launched. She keeps her focus on inspiring people and giving insight on topics like graphic design, illustrations, education, business, marketing, and more.

Thousands of vector graphics for your projects.
Hey! You made it all the way to the bottom!
Here are some other articles we think you may like:

Monster Business Card Template in Illustrator (Tutorial + Freebie)
by Iveta Pavlova
How-To Tutorials
Character animator tutorials part 3: basic puppet in photoshop.
by Slavena Simeonova

Top 16 Tutorials to Learn Adobe Character Animator [2022]
by Lyudmil Enchev
Looking for Design Bundles or Cartoon Characters?
A source of high-quality vector graphics offering a huge variety of premade character designs, graphic design bundles, Adobe Character Animator puppets, and more.
How-To Geek
How to make an infographic in microsoft powerpoint.
You can make a beautiful infographic without using complex software like Photoshop.
Quick Links
Choose a template for your infographic, create a custom slide size, add, edit, and format slide elements, save your infographic as an image.
Microsoft PowerPoint is known for presentations, but if you properly utilize some of the basic tools PowerPoint has to offer, you can also design a beautiful infographic and then download it as an image to use as you wish.
The PowerPoint template you choose will act as the background for your infographic, so choosing one that matches your imagined design is important. You'll need to consider various things when choosing a theme, such as which color text you want to use, if the objects you insert are dark or light in color, and even what type of impression (serious, funny, entertaining, etc) you want your infographic to give.
When you launch PowerPoint, the first thing you need to do is choose the theme. You can choose "Blank Presentation" if you want a plain white background, or you can choose one of the various other templates provided in PowerPoint's large library.
To choose a template, open PowerPoint and click "New" in the left-hand pane.
On the next screen, you'll find a long list of themes to choose from. If you can find one that works for you, you can also try searching for a theme in the Search box. For example, if you want a blue theme, you can search "Blue" in the Search box.
Once you've found the theme you want to use, click it to select it.
A pop-up window will appear, giving you more information about the theme. Click "Create" after reading through the additional information.
You'll now be ready to create your infographic using the selected theme.
Once you've chosen a theme, you'll need to create a custom slide size. The size you need to use depends on where you'll be sharing the infographic. We'll be using the standard size for legal infographics (8.5 x 14 inches) in this example, but check out Easelly's fantastic infographic size reference sheet to find which dimension you should use for your project.
To change the slide size , click "Slide Size" in the Customize group of the Design tab.
Next, click "Custom Slide Size" in the menu that appears.
The Slide Size window will appear. Adjust the dimensions of the width and height by clicking the up and down arrows to the right of each box. Note that the "Slides Sized For" will automatically change to "Custom" when you edit the dimensions.
Click "OK" when ready.
Another window will appear telling you that you're changing the size of your slides and will give you a choice on what to do with the elements within the slide. This doesn't matter much right now since you haven't added any content, but choosing "Ensure Fit" will resize the default title text that we'll use later to a more appropriate size, so go ahead and click that.
You'll now see the slides have been resized. However, the main design of your theme may not fit the entire slide, so PowerPoint fills in the additional space with a color that compliments the theme. If you choose to, you can fill this additional space with the main design by clicking and dragging the handles on each respective side of the design element.
Doing this may or may not distort the design, so use your best judgment on how to move forward here.
Now that the slide is the correct size, you can begin adding, editing, and formating different elements to your infographic.
How you design your infographic depends on what sort of information you want to convey to the reader. There's not a "one-size-fits-all" solution here, so play around with different elements until you're happy with the design.
To Insert a text box, click Insert > Text Box. Your cursor will turn into a cross. Click and drag your cursor across the slide to draw the text box, and then begin typing to enter the text. You can also click and drag the text box to a new position on the slide.
You can update the font of your text using the options in the Font group of the Home tab. These options include things like changing the font style or size, adding bold, italics, or underline to the font, and changing the font color.
You can also insert images, SmartArt, Charts, and other objects by using the options in the Images and Illustrations groups of the Insert tab. Properly using different visuals is the key to making your infographic successful.
Related: How to Insert a Picture or Other Object in Microsoft Office
You can reposition a graphic by clicking and dragging its box, just as you would a text box. You can also resize them by clicking and dragging the handles on each side.
There are also object-formatting tools found in the object's Format tab. To show this tab, you'll first need to select the object. You can do things such as change the color of the shape or shape outline , add different effects (like a shadow ), and so on.
Continue adding, editing, formatting, and repositioning text and other objects until your infographic is complete.
Related: How to Add or Remove Shadows on Objects in PowerPoint
Once you're finished designing the infographic, you'll want to save it as an image so you can easily share it. Luckily, you can save a single PowerPoint slide as an image .
First, select the slide that you want to save as an image in the left-hand pane. A red box will appear around the slide when selected.
Next, click File > Save As, and then choose the location you would like to save your infographic. Before clicking Save though, you'll want to change the file type it is saved as. You can choose between these five image types:
- Animated GIF Format (*.gif)
- JPEG File Interchange Format (*.jpg)
- PNG Portable Network Graphics Format (*.png)
- TIFF Tag Image File Format (*.tif)
- Scalable Vector Graphics Format (*.svg)
Related: What's the Difference Between JPG, PNG, and GIF?
Click "Save" after you've chosen the desired image file type.
A dialog window will appear asking you which slide you want to export. Select "Just This One" to save the selected slide as an image.
Your infographic is now saved as the selected image file type.
That's all there is to it. PowerPoint is a great application for design and, even though it may not be as comprehensive in its image editing tools as Photoshop, it has a much smaller learning curve. If you're ready to take your infographic to the next level, though, there's no better time to start learning Photoshop than now.
Related: How to Learn Photoshop
35+ Best Infographic PowerPoint Templates (For Data Presentations)
Data visualization plays a big role in delivering more convincing and effective presentations. If you look at any of the slideshows on Slideshare , you’ll notice that they all have at least one or two infographic slides showing stats and data about the subject matter.
That’s because presenting data is the best way to prove and validate your claims. It’s actually very easy to create an infographic slide in PowerPoint to present your data in visual form.
In fact, there are pre-made PowerPoint infographic templates you can use to easily add beautiful infographic slides to your own presentations.
For this post, we handpicked some of the best PowerPoint infographic templates for you to explore. Have a look and see if you can find a great infographic design for your slideshow.
How Does Unlimited PowerPoint Templates Sound?
Download thousands of PowerPoint templates, and many other design elements, with a monthly Envato Elements membership. It starts at $16 per month, and gives you unlimited access to a growing library of over 2,000,000 presentation templates, fonts, photos, graphics, and more.

Pitch PowerPoint

Minimal PPT Templates
Clean & clear.
Explore PowerPoint Templates
Professional Infographic PowerPoint Template

The color schemes and the designs used in this PowerPoint template make it a great choice for designing infographics for professional presentations. There are 30 unique infographic slides included in the template with easily editable designs. The slides are available in Full HD resolution as well.
Layered Infographic PowerPoint Template

Editing the infographic slides in this template is easy as drag and drop. This PowerPoint template includes 30 different slides with various styles of infographic designs that are ideal for business presentations. The slides are available in dark and light color themes. You can also change colors using over 90 XML color schemes.
Timeline Infographic PowerPoint Template

Timeline infographics are a must-have slide in presenting project proposals as well as pitch decks. With this PowerPoint template, you’ll have plenty of choices for finding the perfect timeline infographic for your presentations. The template includes 10 unique timeline infographics with unlimited color options and easily editable designs.
Business Infographic PowerPoint Template

If you’re searching for infographic slides for a corporate or business presentation, the infographic slides in this template will come in handy. It has more than 30 unique infographic slides with professional designs. They are also easy to customize and include master slide layouts as well.
Creative Infographic PowerPoint Slides Kit

This PowerPoint template also features 30 high-quality infographic slide layouts that are most suitable for business slideshows. The slides feature transition animations, master slides, image placeholders, and much more to make the process of designing infographics much easier for you.
Free Technology Infographics PowerPoint Template

This is a free PowerPoint template that includes infographic slides with technology-themed designs. There are 30 unique slides included in this template that are perfect for tech startup and business presentations.
Free Project Management Infographics for PowerPoint

This free PowerPoint template features many unique slide designs that are perfect for all sorts of project management presentations. It has 30 different slides with editable layouts. The template comes in Google Slides version as well.
Stages of Customer Journey PowerPoint Template

This PowerPoint template includes a very useful and important set of infographic slides that will allow you to create customer journey maps. There are 20 unique slides in this template featuring multiple styles of customer journey infographics. They all come in light and dark color themes.
SWOT Strategy PowerPoint Infographics Template

Make your SWOT analysis much easier to understand with these PowerPoint infographic slides. It lets you choose from multiple styles of infographic designs to show your SWOT analysis in visual form.
Generation Comparison Infographics PowerPoint Template

This PowerPoint infographic template kit will come in handy when making market and audience research presentations. It includes 16 different styles of infographics for comparing the audience data of your market research. The slides are available in multiple color schemes as well.
Porter’s Five Forces Analysis for PowerPoint

Porter’s Five Forces is another useful marketing tool used to identify and understand the competitors of a business. With this PowerPoint template, you can create a detailed presentation to showcase your competitor research. It includes 27 slides with lots of customizable infographics.
Free Product Crowdfunding Pitch Deck Infographics

You can download this PowerPoint template for free to create pitch decks for crowdfunding projects. It includes 32 slides with many different styles of infographic designs. The template is available in Google Slides format too.
Overlapping Shapes Infographic PowerPoint Template

This PowerPoint template includes a collection of infographics that feature overlapping shapes in circles. This type of infographic is very useful for showcasing categories and groups to better understand the data. There are 16 unique infographic slides in this template.
Mura – Infographic PowerPoint Templates

Mura PowerPoint template has a selection of infographic slides that are commonly used in business and marketing presentations. There are over 35 different slides included in this template with easily editable layouts, colors, and free fonts.
3D Diagram Infographic PowerPoint Template

This PowerPoint includes some creative 3D infographics with different styles of diagram designs. They are perfect for showing off your data in a modern and more attractive way. It comes with 30 unique slides that are available in light and dark themes.
Management Timeline Infographic PowerPoint Template

A collection of management timeline infographics for business presentations. This template includes 16 infographic slides with multiple color themes to choose from. You can fully customize each slide to change colors and icons too.
Free Marketing Infographics PowerPoint Template

This PowerPoint template is also free to download. It comes with more than 30 unique slides featuring colorful and creative marketing-themed infographics. The slides include icon packs and customizable graphics.
Colorful PowerPoint Infographic Template

If you’re a fan of colorful infographic designs, this PowerPoint template is a must-have for you. It features a set of 30 unique slides with many different styles of infographic layouts. You can use them to design slides for all kinds of data presentations. The infographic designs and the colors are editable as well.
Circle – PowerPoint Infographic Template

This PowerPoint template uses a special approach to its infographic slide designs. They are all designed based on circle layouts. The template includes 32 unique slide designs with circle-themed infographics. You’ll find many useful and creative infographics and chart designs in this template, especially useful for business presentations.
Business & Finance Infographic PowerPoint Slides

The infographic slides in this PowerPoint template are made with business and finance presentations in mind. There are various styles of timeline, workflow, flowchart, and various other infographic designs among the slides. Each slide comes with animated designs and you get to choose from over 20 different color schemes as well.
Multipurpose Infographics PowerPoint Template

Another big collection of infographic PowerPoint slides. The infographic designs in this template feature multipurpose layouts so you can customize them to create graphs and charts for many different types of purposes. All of the graphics and shapes in this template are fully scalable as well.
Minimal Animated PowerPoint Infographics

Sometimes the best approach to grab attention to your presentation is to use simple and minimal designs. This PowerPoint template will help you achieve that goal. It features animated infographic slides that feature clean and minimal layouts. There are 18 unique slides in this template with 50 XML color themes to choose from.
Free Infographic Template for PowerPoint

This beautiful PowerPoint template comes with a set of creative infographic slide designs. The free version of the template includes 5 different infographics that you can easily customize to your preference.
Free Animated PowerPoint Infographic Slides

Another free PowerPoint template with beautiful infographic slide designs. Each slide in this template comes with fully animated designs. And they come in light and dark color themes as well.
Arrow Infographic PowerPoint Template
This infographic PowerPoint template is all about arrows. It features 10 unique infographic slides with various designs involving arrows. They are most suitable for making infographics to showcase your journey, development plans, progress, and more. The slides can be customized to change colors to your preference.
Data Visualization – PowerPoint Infographics Slides

Presenting data through your slides won’t be a problem when you have this PowerPoint template at your side. It comes with 33 unique slides that feature many different types of infographic designs. The slides are available in 12 different color variations and editable graphic elements.
Funnel Infographic PowerPoint Template

Professional marketers will surely find this PowerPoint template most useful. Creating funnels is a big part of planning marketing campaigns. With these infographic slides, you’ll be able to easily visualize your funnels in infographic form. There are 30 different infographic slides included in this template.
Sketchy Infographic PowerPoint Template

This PowerPoint template uses a different style of design. The infographics are made with a sketch drawing-style design to give them a hand-crafted look and feel. If you want to create infographics in a more creative style, this template will prove useful. It includes a total of 62 slides, featuring 31 unique slides in light and dark color themes.
Tree PowerPoint Infographics Template

The tree infographic designs are useful when showcasing growth and progress. This PowerPoint template will help you design such infographic slides to present your projects in a beautiful way. You get to choose from 30 unique infographic slides that can be customized with 90 XML color themes.
Free Process Diagrams PowerPoint Infographics

Streamline and visualize your process using the slides in this free PowerPoint template. It features 30 different slide designs with various styles of infographics you can use to create process diagrams.
Free Timeline Infographic Slides for PowerPoint

This PowerPoint template is also free to download. It includes 30 unique slides with timeline infographic designs. They are perfect for presenting your project timelines and business projections.
3D Infographics PowerPoint Template

With this PowerPoint template, you can design infographic slides with 3D-like designs. It features 10 creative infographic slides with 3D cylindrical, pyramid, arrow, and many different styles of designs. You can also customize each slide to your preference in just a few steps.
Business Growth – PowerPoint Infographics Slides

The slides in this template are designed for showcasing growth and progress. It has 33 unique slides with infographics you can use to showcase your business growth. The templates are available in 11 different color schemes and they include animations as well.
SWOT – PowerPoint Infographics Slides

The SWOT analysis is a popular technique marketers use to assess businesses. This PowerPoint template will allow you to create more effective SWOT infographic slides to visualize your analysis in your presentations. It includes a total of 35 PowerPoint slides with different styles of designs.
How to Create an Infographic in PowerPoint
The easiest way to create beautiful infographics in PowerPoint is to use a pre-made template. We recommend that you grab a template from the collection above to easily design a professional-looking infographic for presentations.

- Simply download the PowerPoint infographic template
- Double-click the PPTX file to open it in PowerPoint
- And start adding your own data to the infographic slides

You can also copy and paste an infographic slide from a template over to a different slideshow. Right-click on the slide preview on the panel on the left-hand side. Then select copy. Now create a blank slide in your slideshow and press Control + V to paste the slide design.
You can also design infographics directly in PowerPoint. This, however, requires a lot of work and design skills. You can check out this quick YouTube tutorial to get an idea about how to design infographics in PowerPoint. And then watch this guide for step-by-step instructions.

Microsoft 365 Life Hacks > Presentations > How to Create Infographics to Explain Complicated Concepts
How to Create Infographics to Explain Complicated Concepts
An infographic can be an effective way to share information with others. Learn how to explain complicated concepts to others with these educational visual aids.

Why Use Infographics?
An infographic is a visual representation of information or data. They’re typically a collection of images, charts, and graphs, along with minimal or simplified text that provides an overview of a topic that is easy for the reader to understand. They can communicate information quickly and clearly that might otherwise require extensive explanation.

Tell your story with captivating presentations
Powerpoint empowers you to develop well-designed content across all your devices
An infographic can grab a reader’s attention and share a lot of information succinctly. They can provide a quick overview of a broad topic and cover a lot of informational bullet points. An infographic can be an effective way to share data or research findings or to compare multiple options.
When you need to explain something that would be difficult—or laborious, or long—to share with words alone, an infographic is an excellent tool.
How to Create an Infographic
When deciding how to visually share your information, follow these steps to create an infographic that is effective and engaging.
Outline Your Infographic’s Goals
Before you get started on an eye-catching design you must first consider the goals for your infographic. Outline what exactly you’re trying to explain or communicate.
Are you trying to share data, explain a concept, or change someone’s mind? Your goal will guide which information you use as well as the way in which you choose to visualize it. Your infographic should leave your intended audience with a specific takeaway.
Once you’ve determined your goal, think of supporting questions your readers might ask that you can answer through your infographic. The goal is to share enough pertinent information without losing interest or confusing your point. This can help you create a framework for telling a compelling story and sharing a complicated concept with ease.
Collect Your Data
An infographic can’t exist without data. If you’re trying to visually explain a complicated concept, you’ll need to consider that concept from an outside perspective. Someone who is unfamiliar with the concept will have a lot of questions and it’s your job to answer them concisely. Collect all the information available to you about the concept and organize it logically.
If the topic you’re explaining has a logical beginning and end, collect your data following this path. Collect all relevant steps, statistics, and percentages that will best help you share your information and explain the concept at hand.
Remember that you may be sharing your graphic with someone who is brand new to your topic. Include enough introductory information so a newcomer will be able to readily understand the concept.
Visualize Your Data
Your next step is to decide how you’re going to visually present your data, based on your goals and your audience.
- To show how trends have changed, use a line chart or timeline.
- Maps can show how data differs by location.
- Reveal complex relationships with scatterplots that highlight two variables at once.
- Organize your data to highlight groups, patterns, order, and rank.
- Use lists, tables, Venn diagrams, and flowcharts to help your readers understand how data is divided and connected.
- Show similarities and differences by comparing data using different types of charts or graphs. Bar graphs compare independent values for single variables. Pie charts can compare parts of a whole.
- Inform your readers about important messages or data points by highlighting them. This information can stand out with bold text, bright colors, and colorful icons and graphics. Simple charts can help illustrate a statistic or percentage to drive home the point.
Create Your Layout
Consider the natural flow of information when choosing your infographic layout. Inform your reader what they’ll learn from your graphic and follow that up with charts and data visualizations that answer a reader’s potential follow-up questions.
You may find that using a grid layout can add structure and help you guide your reader through the information. A single column can share information in a linear fashion from top to bottom. Two columns are great for comparing one set of information against another. If the order of information is less important, consider giving each bullet point its own section to make it stand alone.
Giving your layout a sense of structure will make it more visually appealing and will make it easier for your reader to follow along, especially if you’re sharing a more complicated concept.
Add Some Style
Now that you’ve compiled your data and nailed your layout, it’s time to add a little flair to ensure that your infographic is visually pleasing in addition to being informative. Even though you’re keeping your text simple, you can still have a little fun with different fonts , especially with headers and highlights. Make sure to keep things easy to read.
Color can help tell your story. Choose an eye-catching palette but ensure that your graphic remains simple and readable. An infographic that’s too busy might be hard to follow. You’ll also want to consider your graphics and symbols. Consider breaking up your text with simple shapes and images that match your copy. You can use color to highlight important data or group related information.
A good infographic can explain a complicated concept with relevant data, graphics, and good organizational flow. There are many programs you can use to create them, including Microsoft Powerpoint , which offers endless ways to display and share your data.
Get started with Microsoft 365
It’s the Office you know, plus the tools to help you work better together, so you can get more done—anytime, anywhere.
Topics in this article
More articles like this one.

How to create an educational presentation
Use PowerPoint to create dynamic and engaging presentations that foster effective learning.

Five tips for choosing the right PowerPoint template
Choose an appropriate PowerPoint template to elevate your presentation’s storytelling. Consider time length, audience and other presentation elements when selecting a template.

How you can use AI to help you make the perfect presentation handouts
Learn how AI can help you organize and create handouts for your next presentation.

How to use AI to help improve your presentations
Your PowerPoint presentations are about to get a boost when you use AI to improve a PowerPoint presentation.
Everything you need to achieve more in less time
Get powerful productivity and security apps with Microsoft 365

Explore Other Categories
Home PowerPoint Templates Infographics
217+ Infographics PowerPoint Templates & Slides for Presentations
Presentations using infographics PowerPoint templates are a good option for capturing audience attention when explaining complex data. It is an easy to understand representation of data. The Business Infographics templates are the most popular among this category. In this category, you can download 100% editable infographic templates for presentations in PowerPoint and Google Slides.
Featured Templates

Infographic PowerPoint

Professional Report Infographics PowerPoint Template
Infographic Dashboard Elements PowerPoint Template
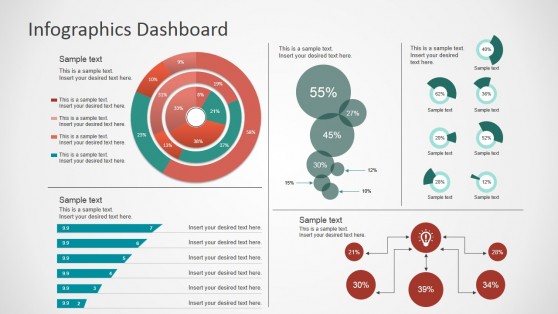
Simple Infographics Dashboard for PowerPoint
Latest templates.
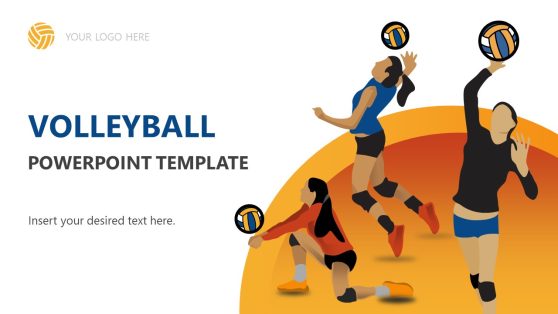
Volleyball PowerPoint Template

7 Steps Waterdrop PowerPoint Infographic

6-Milestone Hanging Platforms Timeline PowerPoint Template

5 Steps Waterdrop Infographic PowerPoint Diagram
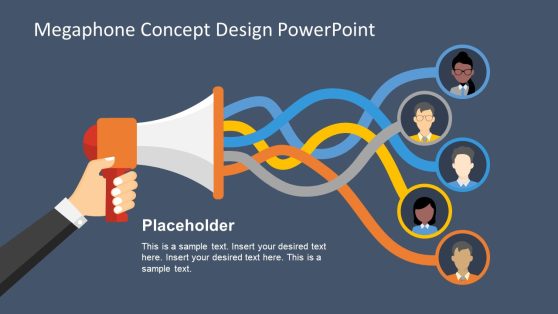
Megaphone Concept Design PowerPoint Template
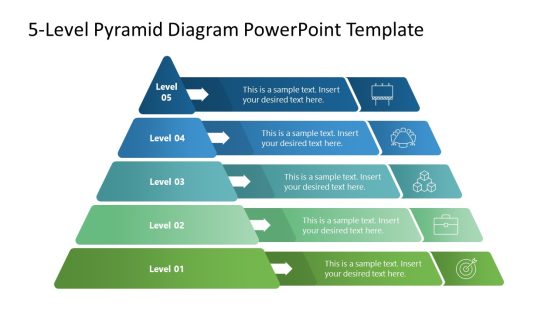
5-Level Pyramid Diagram PowerPoint Template

6 Steps Waterdrop Infographic PowerPoint Diagram
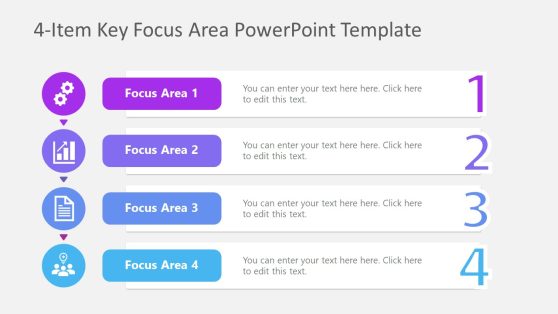
4-Item Key Focus Area PowerPoint Template
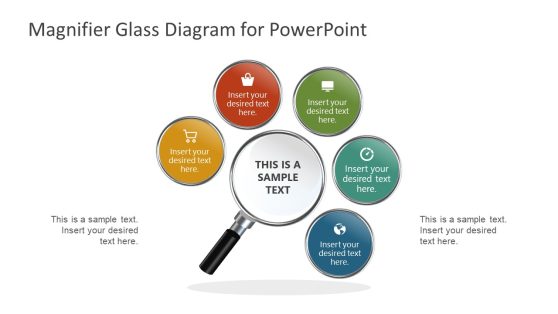
5-Step Magnifying Glass PowerPoint Template
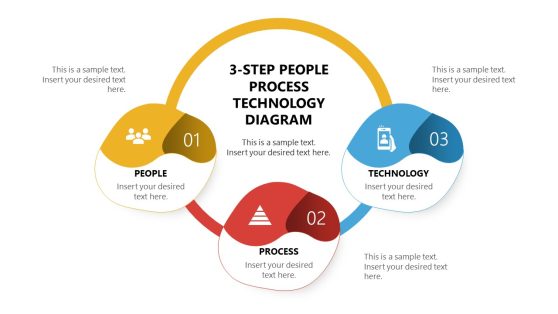
3-Step People Process Technology Diagram Template for PowerPoint
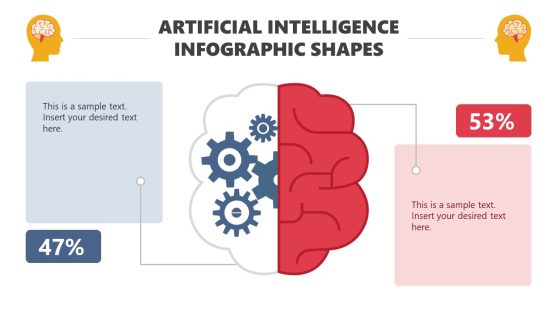
Artificial Intelligence Infographic Shapes for PowerPoint
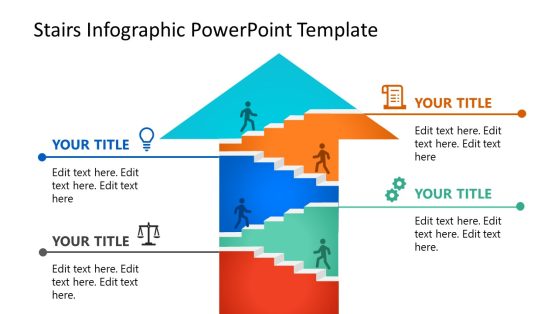
Stairs Infographic PowerPoint Template
These infographic presentation slide templates have high demand within educational presentations and business presentations. In the first audience, because infographics have a good effect in learning; students retain more information transmitted through visual slides . In the latter audience, infographics have popularity for presenting statistics and KPI’s for executive summaries.
For creating statistical analysis on PowerPoint, Infographics PowerPoint Slides Templates play an important role. Whenever you will be using Infographics PowerPoint templates, it will help you present the key facts in your presentation to give your audience a chance to determine your idea.
The Infographics PowerPoint Templates Tag is a collection of Presentation templates created with the purpose of showcasing information though the use of illustrations and graphics. You will find a wide range of templates with different structured:
- Diagram based: this means that the core of the template is a diagram which can be edited to show different amounts of values (data) in a visual way. It is also used to show differences in a process.
- Iconographic based: These templates use a set of icons representing a metaphor and some coloring feature provide the value. For example when you use a male or female icon and use a color code to represent a value.
- Dashboard based: These templates display in a single visualization, several charts which are contextualized through the use of scenes or icons.
Exploring the PowerPoint infographics in the category, is a suitable practice to find several elements to use in your presentation. In general, users do no use only one infographics for PPT presentations, they combine several elements of different templates to create their visual.
What Are Infographics ?
By definition, an Infographic is the use of images, icons and illustrations to represent data. The term is short for “information graphics”. Its use has become very popular in the last decade due to the evidence that the general audience is a visual learner . People are more prone to understand and retain a message based on data, if it is transmitted through infographics.
What are Infographics PowerPoint Templates?
Infographics PowerPoint templates are editable infographics created in PowerPoint with placeholder features. It typically uses multiple components to capture values of data. Starting from related shapes and diagrams to attention-getting flowcharts, timelines, graphs, images, etc. Selecting an engaging combination and fonts is additionally essential to make an efficient Infographics template . It will contain informative statistics, a successive story, and maybe clearly organized.
How Can Infographics PowerPoint Templates Be Used In Presentations?
The process of using an infographic template in your presentations is slightly different than the one of a traditional presentation.
First, you need to review the data you want to present and classify it according to the message it needs to transmit
- Distribution
- Composition
- Relationship
Secondly, you need to find in the gallery, the metaphor that better contextualizes the data points. For example, if you want to show demographics based on a survey, and want to express the Comparison between male or female, you will use male and female icons. On the other hand, if you want to express the comparison between some data point of people in the US versus Canada, you will use a map. But if you want to show information about a hierarchy relationship, probably you will use a Pyramid diagram or Org chart template .
Finally, you will define the feature that will make the category show up and describe the value of the data point. Based on the previous example, to show percentage of male or female people, we can color the icons area based on the percentage number. For the Maps metaphor we can use Size, making the map bigger or smaller, in a proportional way based on the data point. Based on the category, you will chose the visual slide that better represent the category.
How Can Infographics Be Used in Google Slides Presentations?
Our 100% editable Infographic slides are compatible with Google Slides. You can browse the collection of engaging infographics template designs in our catalog and use any infographic in Google Slides. Learn how to Open templates in Google Slides using the Open in Google Slides button available at SlideModel.
Download Unlimited Content
Our annual unlimited plan let you download unlimited content from slidemodel. save hours of manual work and use awesome slide designs in your next presentation..
How to Create an Infographic in Under an Hour — the 2024 Guide [+ Free Templates]
Published: March 06, 2024
Wouldn’t it be great if creating infographics was as simple as writing text-based blog posts? Usually, it would take a lot of time, effort, and skill to make them — but that doesn’t have to be the case.

In fact, with a plethora of tools that make design much more accessible to people without complex or expensive tools, I find that it’s getting easier to create impactful graphics. That, combined with the importance of visual content in marketing today, means that even if it’s overwhelming, you shouldn’t throw in the towel just yet.

That’s why we decided to do most of the work for you. HubSpot’s Free Infographic Templates in PowerPoint make it easy to create high-quality, professional infographics in under an hour.
You can add your own content to premade outlines in a cinch. And if you need a helping hand, we’ll show how to personalize your infographic in PowerPoint in this post. Keep reading to learn how to make a memorable and effective infographic with ease.
15 Free Infographic Templates
Build better infographics with these free designed templates.
- Color schemes
- Icons & shapes
- Eye-popping themes
You're all set!
Click this link to access this resource at any time.
Table of Contents
How to Make an Infographic
How to make an infographic for free, tips for creating a great infographic.
If you prefer watching, this video shows the process of creating an infographic step-by-step:
- Choose your desired infographic template.
- Decide on a goal for your infographic.
- Identify the audience for your infographic.
- Collect your content and relevant data.
- Download your template to PowerPoint.
- Customize your infographic.
- Include a footer with your sources and logo.
- Promote and publish your infographic.
1. Choose your desired infographic template.
First things first, you have to choose an infographic template appropriate for representing your data.
The important thing is to choose a template that specifically works for the type of data set/content you want to present.
As you saw pictured above, you can download our 15 infographic templates in PowerPoint and choose the template that will best help you communicate your data.

With the infographic complete and published, that’s a wrap. It won’t take you long to create some impressive infographics of your own once you get started — but before you begin, we’ve got some tools to make the creative process even smoother.
Now, you may be wondering how much making an infographic will cost. The good news is you can make engaging and effective infographics for free with many tools on the market. Here are some of our favorites.
Free Infographic Tools

Don't forget to share this post!
Related articles.
![How to Create the Best PowerPoint Presentations [Examples & Templates]](https://blog.hubspot.com/hubfs/powerpoint.webp "powerpoint for infographic design")
How to Create the Best PowerPoint Presentations [Examples & Templates]
![17 PowerPoint Presentation Tips From Pro Presenters [+ Templates]](https://blog.hubspot.com/hubfs/powerpoint-design-tricks_7.webp "powerpoint for infographic design")
17 PowerPoint Presentation Tips From Pro Presenters [+ Templates]
![How to Write an Ecommerce Business Plan [Examples & Template]](https://blog.hubspot.com/hubfs/ecommerce%20business%20plan.png "powerpoint for infographic design")
How to Write an Ecommerce Business Plan [Examples & Template]
![20 Great Examples of PowerPoint Presentation Design [+ Templates]](https://blog.hubspot.com/hubfs/powerpoint-presentation-examples.webp "powerpoint for infographic design")
20 Great Examples of PowerPoint Presentation Design [+ Templates]

Get Buyers to Do What You Want: The Power of Temptation Bundling in Sales

How to Create an Engaging 5-Minute Presentation
![How to Start a Presentation [+ Examples]](https://blog.hubspot.com/hubfs/how-to-start-presenting.webp "powerpoint for infographic design")
How to Start a Presentation [+ Examples]

120 Presentation Topic Ideas Help You Hook Your Audience

The Presenter's Guide to Nailing Your Next PowerPoint
![How to Create a Stunning Presentation Cover Page [+ Examples]](https://blog.hubspot.com/hubfs/presentation-cover-page_3.webp "powerpoint for infographic design")
How to Create a Stunning Presentation Cover Page [+ Examples]
Outline your company's marketing strategy in one simple, coherent plan.
Marketing software that helps you drive revenue, save time and resources, and measure and optimize your investments — all on one easy-to-use platform
Infographics
Discover our range of free, editable infographics for PowerPoint and Google Slides. Our collection offers a variety of charts, diagrams, graphics, and maps, each designed to make your presentations visually compelling and informative. Easily customizable to suit your specific needs, these templates are perfect for business, academic, or personal use. Elevate your presentations with our user-friendly infographics that are crafted to enhance data visualization and audience engagement.

Abstract Petal Diagram
Google Slides , PPTX

Infographic Triangle Cycle

6-Layer Pyramid Projection

5-Layer Pyramid Projection

4-Layer Pyramid Projection

3-Layer Pyramid Projection

8-Blade Pinwheel Diagram

7-Blade Pinwheel Diagram

6-Blade Pinwheel Diagram

5-Blade Pinwheel Diagram

4-Blade Pinwheel Diagram

3-Blade Pinwheel Diagram
Search templates by categories, search templates by colors.
Love our templates? Show your support with a coffee!
Thank you for fueling our creativity.
Charts & Diagrams
Text & Tables
Graphics & Metaphors
Timelines & Planning
Best-Ofs & Tips
Terms and Conditions
Privacy Statement
Cookie Policy
Digital Millennium Copyright Act (DMCA) Policy
© Copyright 2024 Ofeex | PRESENTATIONGO® is a registered trademark | All rights reserved.

To provide the best experiences, we and our partners use technologies like cookies to store and/or access device information. Consenting to these technologies will allow us and our partners to process personal data such as browsing behavior or unique IDs on this site and show (non-) personalized ads. Not consenting or withdrawing consent, may adversely affect certain features and functions.
Click below to consent to the above or make granular choices. Your choices will be applied to this site only. You can change your settings at any time, including withdrawing your consent, by using the toggles on the Cookie Policy, or by clicking on the manage consent button at the bottom of the screen.
Thank you for downloading this template!
Remember, you can use it for free but you have to attribute PresentationGO . For example, you can use the following text:
If you really like our free templates and want to thank/help us, you can:
Thank you for your support
- All Templates
- Full Access
Get Your Presentations DONE in Lightning Speed! 🚀
Create impactful pitch decks, business reports, and marketing visuals in minutes.
Is this a monthly subscription or an one time payment?
How will i receive new updates, which methods of payment do you accept, what are the graphics compatible with, i don’t have any design experience. can i really create infographics, join our newsletter.
Join over 73,913 marketing executives, business consultants, performance coaches, media providers and more.
8118 Fry RD Suite 1304 Cypress, TX 77433
High-quality infographic templates which make your design workflow faster and easier
- Privacy Policy
- Cookie Policy
- Terms & Conditions
- Refund Policy
Copyright © 2024 infograpia.com.
We use essential cookies to make Venngage work. By clicking “Accept All Cookies”, you agree to the storing of cookies on your device to enhance site navigation, analyze site usage, and assist in our marketing efforts.
Manage Cookies
Cookies and similar technologies collect certain information about how you’re using our website. Some of them are essential, and without them you wouldn’t be able to use Venngage. But others are optional, and you get to choose whether we use them or not.
Strictly Necessary Cookies
These cookies are always on, as they’re essential for making Venngage work, and making it safe. Without these cookies, services you’ve asked for can’t be provided.
Show cookie providers
- Google Login
Functionality Cookies
These cookies help us provide enhanced functionality and personalisation, and remember your settings. They may be set by us or by third party providers.
Performance Cookies
These cookies help us analyze how many people are using Venngage, where they come from and how they're using it. If you opt out of these cookies, we can’t get feedback to make Venngage better for you and all our users.
- Google Analytics
Targeting Cookies
These cookies are set by our advertising partners to track your activity and show you relevant Venngage ads on other sites as you browse the internet.
- Google Tag Manager
- Infographics
- Daily Infographics
- Popular Templates
- Accessibility
- Graphic Design
- Graphs and Charts
- Data Visualization
- Human Resources
- Beginner Guides
Blog Infographics How to Create an Infographic in PowerPoint
How to Create an Infographic in PowerPoint
Written by: Tobi Ojenike Feb 21, 2024

Infographics and PowerPoint are both powerful mediums to visually share information. So what happens when you combine both?
You get the superhuman ability to present information and hold people’s attention.
But creating infographics isn’t as straightforward as a slide deck. Fortunately, you can use PowerPoint itself to create infographics. Nothing to worry about, right? If you like dull infographics, then sure.
But if you want to create professional infographics that take your presentations to the next level, you need an easy-to-use Infographic Maker and customizable infographic templates that integrate into your presentations.
Click to jump ahead:
What is an infographic?
- How to use infographics in PowerPoint
- How to create infographics in PowerPoint
How to create infographics with Venngage
An infographic is a visual that combines graphics, charts, text, and images to show data, explain concepts, or convey messages in a concise format.
They’re very popular, especially in presentations. Why?
Because they keep people’s eyes on the screen…literally.
Jokes aside, infographics allow you to present information or engage in data visualization in very little space effectively.
Here’s a great example example of a presentation that uses infographics well:

How to use infographics in PowerPoint
PowerPoint presentation slides are meant to hold the audience’s attention. This is why you’re taught to use visuals over text when possible.
However, no one talks about infographics in presentations even though they help add an extra level of visual oomph.
Here are some ways you can use infographics in PowerPoint to your advantage:
Make things easy to remember
Infographics can simplify concepts and present data in a clear manner, which makes them an ideal tool to get people to remember important parts of your presentation.
Here’s an example of an infographic that can be powerful in a presentation.

Present research
Presenting raw research in PowerPoint is challenging, but again infographics are a great solution.
They can convert complex data into something visually engaging that is accessible and understandable to your audience.
Here’s a great example of how you can present research with infographics:

Transform complex data into digestible content
Presenting a lot of data points in PowerPoint can be challenging.
But if you use an infographic, you can combine the power of charts and graphs with visuals to highlight key insights and trends.
Here’s an example of an infographic that does this well:

Explain a process
Explaining processes is a key goal of business reports. But doing with PowerPoint slides can be cumbersome. Do you really need a new slide to present each step?
You might, unless you use an infographics which are great at providing a deep understanding by presenting information sequentially.
Here’s an example of a process infographic that’ll work great in PowerPoint:

Make things easy to compare
Infographics are also great at comparing different sets of data, ideas, or scenarios.
If you want to compare data, products, or stats, forget about flipping back and forth between slides and use an infographic instead.
Comparison infographics help viewers quickly grasp similarities, differences, and relative magnitudes without getting lost.
Here’s a comparison infographic that’ll make a great addition to any PowerPoint presentation.

Examples of PowerPoint infographics
Now that you’ve seen how infographics help make presentations better, let’s see a few examples of PowerPoint slides that integrate infographics effectively.
Timeline infographic

Geographical infographic

How to create an infographic in PowerPoint
If you’ve got a copy of PowerPoint on your device, the good news is that you can create infographics for your presentations right within the tool itself.
Here’s an overview of how to create an infographic in PowerPoint (don’t miss the detailed walk-through below!).
Create a new presentation
- Select the “ SmartArt ” option
- Choose your infographic template
- Format and customize your infographic
- Review and finalize
Load up PowerPoint and select the “Blank Presentation” option.
If you already have an existing presentation open, select “File” > “New”.

Navigate to the SmartArt option
To add an infographic to your slide, you’ll need to select a infographic template from PowerPoint’s library.
To find it, click on “ Insert ” > “ SmartArt “. You should see options to add various infographic types like process infographics and list infographics.

Insert your infographic
Once you’ve chose an infographic type, hit “ OK “.
In my case, I went with a process infographic. Your slide should look something similar to this.

Notice the “ SmartArt Design” and “ Format ” tabs that show up when you have the infographic selected? These are your go-to tabs for infographic customization, but I’ll come back to that later.
Add text and images
PowerPoint gives you only a basic infographic structure which means you have to add text and images manually.
While text is easy to add, trying to insert images into PowerPoint infographics is a real headache.
For example, this is what happens when I try to insert a stock image into one of my process box.

It was a disaster! To make this usable, I’ll have to manually shrink the size and make it fit into its proper location.

Customize your infographic
Let’s ignore for a minute our image debacle from the previous step.
If you have a text-only infographic, “ SmartArt Design” and “ Format ” options make editable infographics a reality. You can easily adjust colors or text for an infographic in a PowerPoint slide.
For example, I was able to change the layout and style of my infographic using pre-made settings. It took just two clicks.

Save and share your infographic
Once you’re done editing and like the end product, your infographic is ready!
The good thing about PowerPoint infographics is that you don’t have to save them anywhere unique since they’re already part of the presentation.
But besides that, there are many things I wish that could have been done better.
For example, I don’t know if you noticed, but PowerPoint has a severe limitation when it comes to templates and layouts.
For a tool that’s all about creativity, it’s a bit of a let-down that you can’t give infographics the ideal touch you want (remember how difficult it was to add images to my infographic?).
There are other other platforms you can use like Google Slides which also offer a variety of PowerPoint templates, but they still won’t give you the creative capabilities of Venngage.
With PowerPoint, basic and boring infographics is what you can expect.
But with Venngage, you can create your own infographics that are colorful, cool, and easy to customize and make your own even if you don’t have design skills.
Note: Some of our infographic templates are free to use and some require a small monthly fee. Sign-up is always free, as is access to Venngage’s online drag-and-drop editor.
And the best part?
It’s free to use and Venngage infographics integrate right into PowerPoint.
Step 1 – Sign up for a Venngage account (it’s free!)
Sign up for a Venngage account using your email, Gmail or Facebook account.

Step 2 – Select a infographic template from our library
Venngage offers tens of thousands of free templates that’ll help you present information in a format that is more engaging.
Whether you need a comparison infographic , geographic infographic , statistical infographic, browse our infographic templates to find one that you want to integrate into a presentation.

Step 3 – Edit your infographic in a few clicks
With Venngage templates, you don’t need to be a designer or need design skills to create beautiful infographics for PowerPoint.
For example, let’s say I want to edit this timeline infographic :

Want to replace icons or change the color scheme? Venngage provides access to an in-editor library of thousands of free, professional icons, plus diverse icons
Just pick an element and click replace.

Also, the Venngage editor has accessibility built in! This means you can test your design for factors like color contrast and more to ensure people living with impairments can understand your designs.
There’s no need to remediate!
To test your design click on “ File ” > “ Accessibility ” to get access to the accessibility checker.

Not only does Venngage tell you if your design passes or fails certain parameters, but it also tells you where issues are.
Step 4 – Share a link to your infographic for free or upgrade to download
When you’re happy with a design, you have two options. If you’re a free user, you can share a link to your infographic or free.
But if you have a Business plan, you can download your infographic as PNG, PDF, or even as PPT.

I saved my infographic as PowerPoint file and here’s how the Venngage template looks in PowerPoint.

With a Business account, you’ll also get access to My Brand Kit , which lets you apply your brand colors to any template with one click.
Conclusion: Leave boring visuals behind and level up your presentations with Venngage infographics
If you want to create presentations that actually get people’s attention, then say no to PowerPoint infographics.
Instead, use Venngage to create colorful and polished infographics that’ll make your presentations engaging and leave everyone talking long after.
Frequently Asked Questions
What is the difference between a powerpoint and an infographic.
PowerPoint presentations and infographics serve distinct purposes. PowerPoint presentations deliver information in structured format and consist of slides containing text, images, and multimedia elements. In contrast, infographics are visual representations of data or concepts designed to convey complex ideas quickly and clearly.
Why do we use infographics in presentation?
Infographics are used in presentations to enhance comprehension, engagement, and retention of information. By condensing complex data or concepts into visually appealing graphics, infographics make it easier for audiences to grasp key points quickly. In a presentation, infographics captivate viewers and convey information more effectively than traditional text-heavy slides.
What is an infographic template in PowerPoint?
An infographic template in PowerPoint is a pre-designed layout or framework that provides a visual structure for creating infographics. These templates typically include placeholders for various infographic elements such as text boxes, charts, graphs, icons, and images, arranged in a visually appealing and organized manner.
Discover popular designs

Infographic maker

Brochure maker

White paper online

Newsletter creator

Flyer maker

Timeline maker

Letterhead maker

Mind map maker

Ebook maker
Find the perfect PowerPoint presentation template
Bring your next presentation to life with customizable powerpoint design templates. whether you're wowing with stats via charts and graphs or putting your latest and greatest ideas on display, you'll find a powerpoint presentation template to make your ideas pop., presentations.
Help your data, insights, and recommendations make a statement with beautiful and easily customizable presentation templates.

Certificates
Celebrate accomplishments big and small with customizable certificate templates. From gift certificates to awards for finishing a course or training, find a template that highlights their accolades.

Boost visibility for your show, project, or business with easily customizable poster templates. Find templates for all your promotion needs and make them uniquely yours in a flash.

Keep track of whatever you need to in style. From personal planning to promotional calendars, find templates for every kind of project and aesthetic.

Infographics
Say more with less using helpful and easily customizable infographic templates. Add clarity to business presentations, school projects, and more with these helpful templates.
Start with the best PowerPoint templates

Elevate your storytelling
Tips, tricks, and insider advice from our business and design experts
A quick way to create beautiful, powerful PowerPoint presentations
Create captivating, informative content for PowerPoint in just a few minutes—no graphic design experience needed. Here's how:

1. Find the perfect PowerPoint template
2. Customize your creation
3. Show it off
Let's create a powerpoint design, frequently asked questions, where can i find slide templates and themes that i can customize.
To find customizable slide templates and themes, you can explore the business presentations templates or search by PowerPoint templates . Once you find a template that resonates with you, customize it by changing its color scheme, add in your own photos, and swap out the font.
How do I use pre-made PowerPoint templates?
After you've chosen a PowerPoint template to use, customize it. Explore [design tips] on how to customize a deck that resonates with your brand while putting emphasis on the topic at hand. Play with other design elements, like photo shapes, to make each slide unique.
How can I make or edit my own custom PowerPoint templates?
Start from scratch by creating your own PowerPoint template . Follow tips for designs and business presentations so that your unique template is cohesive and relevant to your brand. Incorporate your brand's color scheme and graphics so that all your slides aren't text only.
What kinds templates can I get online for PowerPoint?
You can get PowerPoint templates that have modern designs, animated ones, or even hand-drawn art in each slide. The color schemes range from bold to subtle. Each template's slides are also organized based on what you may want to include in your presentation . You can use the template as a starting point and customize its specific details from theme.
Popular categories

+5200 Professional PowerPoint Infographics & Google Slides Templates

See how it works

Microsoft PowerPoint Add-In
Get your infographic templates in seconds
Match your branding colors & fonts
Filter by number of data points
Microsoft approved
Google Slides Add-on
Google approved
100% Editable Infographic Templates Compatible with PowerPoint, Keynote & Google Slides
The infographic templates we provide are all in PowerPoint format (.PPTX). In order to speed up and simplify your editing processes, our templates and slide objects are fully editable in PowerPoint, Google Slides, and Keynote.
100% Vector-based Slides
One click to edit shapes to change colors, size, position, add or remove elements
Vector based never pixelates
One click to edit a fully editable text to change font, color, size.. etc
Small file size in comparing to images
45+ Categories with thousands of infographic templates for PowerPoint & Google slides
More than 5200+ ready-to-use infographics in more than 49 popular categories..
Create visually stunning presentations with our collection of more than 5200+ eye-catching templates. We have an extensive library of infographic templates for both PowerPoint and Google Slides.
The Voice of Our Satisfied Users
These templates are AWESOME-- an essential add on to anyone who is bored with Powerpoint and Google Slides basic templates. In addition to being easy to use, a single click gets these templates to match your existing deck color scheme! So cool! I've used several already and look forward to continuing to explore the hundreds of options- clearly labeled so I can quickly find what I'm looking for. 10/10 recommend!
This has transformed my presentations. It is very easy to use - very intuitive and requires very few technical skills. There are so many features to choose form but they are grouped in a very logical order and are easy to find. Automatically match your current template - style and color. A must have for anyone wanting to upgrade their speaker slides.
Very professional tools in power point. Its more structured with filters and whatever you are searching for you can find it easily And download it and open it easily in Microsoft PowerPoint.
This solution made my life much easier, you can find hundreds of ppt templates sites online, but there is no one except ppt-design that provides it as an "add on" embeded in the office, in addition to that there are very wide variety of designs and fields, you can search easily of what you dream of in your slide and you will find a perfect match at your finger tips with a professional support if needed, much recommended!
One of the professional tools in power point. Its more structured with filters and whatever you are searching for you can find it easily And download it with hassle free … its a way editable and friendly user comparable to any other templates.
The website is just Amazing for anyone who is doing a ppt and don't have the luxury of time doing it step by step. It's really a time saving tool, amazing info-graphics, variety of ideas. And most one I loved is how it is well organized inside
I Personally tried this Add-in, it's simply amazing. Very creative solution that help me in day to day business presentation. I don't have to search for templates for infographics In Addition, it's compatible with any template i use "Matching the templates color automatically. Highly recommended to be used on personal and on business levels. It will be of big added value if added in any corporate devices.
It saved me time and effort to create well designed visuals and slides that presents data in a professional way.
How much at least 20 hours/month worth to you? If your 20 hours are worth more than $10, then definitely it would be a good deal
- Free Templates
- PowerPoint add-in
- Google Slides Add-on
- One User License
- +3000 Templates
- 7-days free trial Skip Trail
- One-year updates
- 500 downloads/month
- Free Customized Template
- Lifetime updates
- Unlimited downloads
Frequently Asked Questions
Could the template fit my presentation colors & fonts.
Yes, just choose “Match current deck” & the template colors & fonts will be changed automatically to match your template colors & fonts without any extra work .
How will I receive new updates?
The template will be continuously be added to the website & add-in, you can check it by sorting the template by “Recently added”.
What If I would like to change the colors or fonts?
All the template are fully editable with shapes & fonts are easily be edited in few clicks.
Which methods of payment do you accept?
We only accept Credit/Debit cards & PayPal.
I don’t have any design experience. Can I add infographics?
You will just have to replace the text & you will have your infographics ready.
To get our regular updates, newly added templates & freebies
50+ PowerPoint (PPT) Infographic Templates for Graphic Presentations
Infographics are a popular way to communicate facts and figures with an audience, and for good reason – they’re easy to interpret and are much more appealing to look at than a great big wall of text. Plus, they can be a great way to break up a paragraph or convey some detailed information without losing engagement or interest, and they can also be customized to reflect your own brand and company style!
With that in mind, infographic templates for PowerPoint are a brilliant tool to have for your next important presentation. You can use an infographic template as a base for your presentation, or simply copy and paste the slides with the best infographics for your purposes.
We’ve scouted around and found the very best free and premium infographic templates for PowerPoint, to help you make your next presentation even more amazing.
One Subscription: Everything You Need for Your PowerPoint Presentation
Get everything you need to give the perfect presentation. From just $16, get unlimited access to thousands of PowerPoint presentation templates, graphics, fonts, and photos.
Build Your PowerPoint Presentation

Analysiz Powerpoint

Bolo PPT Template

Clean Business PPT

The X Note Template

Agency Portfolio PPT

Ciri PPT Template
Business finance powerpoint infographics.

The Business Finance PowerPoint Infographics are a collection of modern finance infographic templates that are compatible with all PowerPoint versions. It comes with 20+ unique slides that are fully customizable and easy to edit. The third-party provided package also includes PPTX files making it a convenient and user-friendly tool for creating impressive business presentations.
Iceberg PowerPoint Infographics

The Iceberg PowerPoint Infographics package offers over 20 unique and contemporary slides compatible with all PowerPoint versions. These beautifully designed templates are perfect for professional business presentations and are easily editable for your specific needs. Moreover, all elements are fully customizable, offering you the flexibility to create a presentation that truly reflects your vision.
Rocket Infographics PowerPoint Template

The rocket-style infographics are one of the most popular infographics used in many different startup and business presentations. This template will give you plenty of options to create a cool rocket infographic for your slideshow. It includes 15 unique slides in light and dark color themes.
Blaise – Infographic PowerPoint Template

With this PowerPoint template, you’ll get 30 different infographic slides with fully customizable designs. You can change the colors, data, and fonts with just a few clicks. There are infographics for sales, marketing, and various other business presentations too.
Funnel Infographics PowerPoint Template

Design the perfect funnel infographic for your business presentations using this PowerPoint template. It comes with a set of 25 unique infographics featuring different styles of funnel designs. They are available in light and dark color schemes.
Arrow Infographics PowerPoint Template
If you want to add an arrow-shaped infographic to your presentation, be sure to grab this template. It includes more than 20 unique arrow-style infographics with cool designs. You can edit and customize them however you like.
Comparison Infographics PowerPoint Template

This PowerPoint template includes a set of infographics for creating comparison tables. These infographics will allow you to compare data, stats, and features to highlight specific details about your business and products. There are 20 unique infographics in this template.
Ething – PowerPoint Infographics Template

Ething is a multipurpose PowerPoint template that comes with various types of infographic slides. It has infographic designs for funnels, timelines, maps, graphs, and more. The template includes a total of 30 different slides.
Inova – Infographic PowerPoint Template

The infographics in this PowerPoint template feature light colors inspired by the flat design. They are ideal for adding infographics to minimalist presentations. Of course, you can also change those colors to your preference. It has 30 unique slides.
Eco Infographic Pack

The Eco Infographic Pack is a collection of 33 unique PowerPoint slides, aimed at delivering eco-friendly presentations. It has diverse features like 11 color variations, easy customisation through Slide Masters, and well-animated slides and transitions. Available in 16:9 Full HD and PPTX format, these slides are perfect for those seeking a simple and captivating way to present their eco-conscious business or personal projects.
Arrows PPT Infographics

Arrows V.2 PPT Infographics is a presentation slide pack offering 33 unique and customizable slides, totaling 35 in all. It features a clean, light background along with 11 color variations, handmade infographics, and simple line vector icons for easy editing. The slides are built with 16:9 Full HD resolution, providing high-quality visuals for business, corporate, or personal presentations.
Strategy PPT Infographic Template

If you’re looking to hunt down the best PowerPoint infographics templates, the above-featured product is well worth checking out. It consists of 30 graphic slides that will fit right into your needs. Give this wonderful ppt infographic template a try.
Multipurpose PowerPoint Infographic Kit

Whether you’re putting together a pitch deck, annual report, or sales presentation, this versatile infographic template for PowerPoint is the best bang for your buck. It consists of 20 graphic slides in HD resolution with a drag and drop placeholder and free fonts.
Multipro – Infographic Template PowerPoint

Multipro is an excellent contender for your cash if you truly value standing out from the pack. It contains 40 painstakingly designed slides that can be fully molded to your specific requirements. It offers the absolute best PowerPoint presentation graphics; do check it out.
Aqua – Infographic Presentation PowerPoint Template

Aqua is a clean, and modern template that deserves to make it to your shortlist. It has everything you need to deliver a standout presentation. When it comes to the best PowerPoint infographic templates, Aqua stands at the top of the league.
Dodet – PowerPoint Infographic Template

Modern, and sophisticated, Dodet is a must-have template for anyone looking to create a good impression on their clients. Dodet is one of our favorite Infographic PowerPoint templates, and you’ll know why when you check it out yourself.
Modern Infographic PowerPoint Template

Here we have an animated ppt template that comes packed with a range of slides, 22 color schemes, free fonts, charts, diagrams, timeline, and much more. The template can be customized in PowerPoint, Google Slides, and Illustrator.
Multipurpose Infographic PowerPoint Template

Ideal for company profile, pitch deck, sales report, and other business-related presentations, this clean and modern template comes with 30 plus slides, free fonts, 16:9 aspect ratio, and a smorgasbord of infographics for you to enjoy.
Edu Infographic PowerPoint Template

Feast your eyes on this simple, elegant, and eye-catching infographics PowerPoint template that you’ll be hard-pressed to pass up. It offers 70 slides in total, light and dark versions, free fonts, and a versatile design that can be put to use for virtually any purpose under the sun.
Circle Infographic PowerPoint Template

Here we have a premium infographic PowerPoint template that features a wide range of circle-based data visualization graphics, arranged across 32 unique slides that are super easy to customize and come in a handy 16:9 widescreen aspect ratio.
Logistic Infographic PowerPoint Template

If you’re putting together a set of graphic slides for a professional and informative presentation, the Logistic infographic template for PowerPoint comes with a series of fully animated slides, versatile icons, a full HD 16:9 aspect ratio, and is incredibly easy to edit.
Bundle Infographic PowerPoint Template

Next up, we have the Bundles set of PowerPoint infographic slide elements that feature more than 315 unique charts, graphs, and other visual elements for displaying your data. There are 11 color variations to choose from, and a total of 3010 individual slides!
Arrow PPT Infographic Template

The next in the list of our PowerPoint infographic templates to be featured is the Arrow template, a multipurpose option that offers a simple, clean design and 30 unique slide layouts complete with animations and transitions. It also comes with free fonts and a full HD widescreen aspect ratio.
Cubix PPT Infographic Template

Next up we have Cubix, an amazing infographic template for PowerPoint offering an incredible 513 unique slides, each with pixel-perfect illustrations, fully editable and resizable graphics, a range of purpose-built slide layouts, and three color themes to choose from. It’s ideal for professional or corporate presentations.
Simple PPT Infographic Template

Featuring more than 400 graphic slides and a classic, simple design that allows the focus to remain on your content, this comprehensive PowerPoint template is ideal for educational presentations and comes with five color schemes and a range of editable vector icons.
Sante PPT Infographic Template

Looking for a set of PowerPoint presentation graphics that will really capture your audience’s attention? Consider the Sante template, a beautiful modern collection of more than 800 unique slides, including eight different color schemes and a range of purpose-built layouts such as product information and company profile slides.
Acile Business PPT Infographic Template

The Acile business infographic template for PowerPoint consists of 150 total slides, including five color variations, built-in free fonts, a high definition widescreen format, and a range of fully editable elements such as text, photos, and shapes that can be customized to suit your needs.
Classic PPT Infographic Template

Offering 145 unique slides, a range of animation options, and a set of 1000 vector icons to help you customize, our next template is a classic option that’s suitable for any informative presentation and includes free support and updates as well as web fonts and easy customization settings.
Military PPT Infographic Template

If you’re searching for a collection of PowerPoint presentation graphics to use for a military-themed project, this template is the perfect fit. It offers a range of customizable infographics that have been specifically designed with a military theme, across 27 different slide layouts and six premade color schemes.
Versatile PPT Infographic Template

This highly versatile set of graphic slides includes an extensive library of vector icons, free fonts, and full animation to help you create an amazing infographic presentation. It’s super easy to edit and comes in a high quality 16:9 format for maximum impact.
Startup PPT Infographic Template

Our next option is one of the best PowerPoint infographic templates for a new startup business to use for an investor pitch, marketing presentation, or product briefing. It comes with 70 unique and powerful slides and a carefully curated color palette, as well as easily editable charts and infographics.
Chart PPT Infographic Template

If you’re needing to include a range of charts and graphs in your presentation, look no further than this handy chart themed set of graphic slides. It features every kind of chart that you can think of, all fully customizable and animated, and includes free fonts and vector icons to help you create the perfect design.
Colourful PPT Infographic Template

This template is perfect if you’re wanting a series of PowerPoint presentation graphics without too much detail, but with an eye-catching design and use of bold colors! It comes with 100 selected colors to help you customize with consistency, and is fully animated for extra impact.
Alphabet PPT Infographic Template

Here we have a truly unique set of PowerPoint infographic templates, all based on letters of the alphabet! It includes 30 unique slides, each with animation and transition options, and is a creative and visually appealing way to communicate with your audience.
Maps PPT Infographic Template

If you’re working on a geography or travel themed project that requires a series of informative yet creative graphic slides, consider this map themed set of 30 infographic slides. It includes a high definition widescreen format, free fonts, and a range of animations and transitions.
Graph PPT Infographic Template

Another great option for presentations that require the use of charts and graphs, this template offers a total of 183 infographic slides, each of which is fully animated and easy to customize. It also comes with a set of 1000 vector icons and free fonts to help you customize.
Tree PPT Infographic Template

This fun, colorful infographic template for PowerPoint includes 30 unique slides featuring a range of tree infographics that are available for you to customize and use in any kind of informative or educational presentation. It offers a clean, simple design with bright, eye-catching colors and graphics.
SWOT PPT Infographic Template

SWOT infographics are a popular tool with a range of uses and detail the strengths, weaknesses, opportunities, and threats of your chosen subject matter. Use these professional and visually appealing SWOT infographics for your next project to really wow your audience.
Food PPT Infographic Template

Food, glorious food! If you’re putting together a presentation based on the food or hospitality industries and need a creative and engaging way to include some statistics or other information, consider this set of 30 unique food-themed graphic slides, each offering a simple, fun design that’s easy to customize.
Medical Infographic Template

This medical infographic ppt includes a wide range of medical elements collection that can be used for different situations. If you are preparing a medical report for your management, sharing conclusions with your fellow team members, giving some medical lectures inside and outside a medicine school, making some research, or trying to give the patient information about his/her state this medical presentation is your saver
Quore – PowerPoint Infographic Template

Creating a presentation from scratch can be quite labor-intensive. Starting with a presentation template from Punkl is beneficial. It saves time, provides good visual design and means that you can primarily spend your time and attention on the content of your presentation.
Eargo – PPT Infographic Template

Now take your Business to the next level with this template in no time. This template is very easy to edit and all elements are fully editable, you don’t need any professional knowledge in design to edit this template from colors to vector images and icons
Bonus: Free PowerPoint (PPT) Infographic Templates for Graphic Presentations
Looking for free infographic templates for your next PowerPoint presentation? You’ll definitely love our featured items. Let’s take a look:
Free Timeline Infographics PowerPoint Template

This free PowerPoint infographics template includes lots of useful timeline graphics for you to use in your presentations. There are 30 different timeline slides in total and you can easily edit them to customize the data.
Free Design Thinking Infographics PPT

A must-have PowerPoint template for UX and design teams. With this template, you can showcase your design thinking process to your teams. It includes more than 30 slides with colorful design thinking infographics.
Free Technology Infographics PowerPoint Template

You get access to some creative and cool technology-themed infographics with this PowerPoint template. It includes fun infographics featuring creative illustrations and designs. And it’s free to use.
Free Abstract Polygonal Space PPT Infographic Template

Here we have a free downloadable template from Free PowerPoint Templates Design featuring an abstract, space-inspired design that’s brilliant for a technology or communications business, or of course, any astronomy or space-themed project. It includes 48 slides and is fully editable.
Free Business Plan Infographic PowerPoint Template

If you are looking for a clean and creative infographics ppt, check out this template that consists of everything you’d expect in a professional presentation. It features more than 9 custom slides, master slide layout, animated transition effects, drag & drop picture placeholder, and is absolutely free. What’s not to love about it?
Free Clean Infographic PowerPoint Template

Next up is a modern and uncluttered PowerPoint template that is sure to make an impression. The template can be fully customized to your preference, and used for a wide range of business and professional applications.
Free Pyramid Chart Infographic PowerPoint Template

Pyramid charts are a super useful and visually appealing way to convey information to an audience, and this PowerPoint infographic template comes with 10 unique slides that will give you a range of vector-based charts to customize with your own data.
Free Arc Charts Infographic PowerPoint Template

Circular arc or gauge charts are a great way to compare results side by side, and are a common data visualization tool for a wide range of purposes that provides an easy way to convey information. This template for PowerPoint and Google Slides is available as a free download from PresentationGo.
Free Animated PPT Infographic Template

Looking for an animated infographic PowerPoint template that won’t break the bank? This free download from SlideModel is a great option and includes a range of 100% editable and professionally designed slides, vector shapes and icons, and a modern 16:9 aspect ratio.
Free Tree PPT Infographic Template

You’ve heard of tree diagrams, but how about using actual trees as infographics in your presentation? With this free template from Free PowerPoint Templates Design, you can do just that – built specifically for finance presentations, it offers 48 unique slides with a range of customization options.
And there you have it, a collection of PowerPoint infographic templates for every kind of project or presentation, enabling you to communicate those important facts and figures with your audience in a fun and engaging way!
Got any suggestions?
We want to hear from you! Send us a message and help improve Slidesgo
Top searches
Trending searches

26 templates

6 templates

first day of school
69 templates

environmental science
37 templates

49 templates
12 templates
Design Elements Infographics
It seems that you like this template, free google slides theme, powerpoint template, and canva presentation template.
This new set of infographics is a jack of all trades. We have created different designs, not tied to a specific topic or purpose, which means they're suitable for the majority of the uses you might come up with. From timelines to graphs, from percentage bars to pie charts. Various colors are used, as well as icons and other resources. Now you can visually represent almost everything!
Features of these infographics
- 100% editable and easy to modify
- 30 different infographics to boost your presentations
- Include icons and Flaticon’s extension for further customization
- Designed to be used in Google Slides, Canva, and Microsoft PowerPoint and Keynote
- 16:9 widescreen format suitable for all types of screens
- Include information about how to edit and customize your infographics
How can I use the infographics?
Am I free to use the templates?
How to attribute the infographics?
Attribution required If you are a free user, you must attribute Slidesgo by keeping the slide where the credits appear. How to attribute?
Related posts on our blog.

How to Add, Duplicate, Move, Delete or Hide Slides in Google Slides

How to Change Layouts in PowerPoint

How to Change the Slide Size in Google Slides
Related presentations.

Premium template
Unlock this template and gain unlimited access

👀 Turn any prompt into captivating visuals in seconds with our AI-powered design generator ✨ Try Piktochart AI!
- Piktochart Visual
- Video Editor
- AI Design Generator
- Infographic Maker
- Banner Maker
- Brochure Maker
- Diagram Maker
- Flowchart Maker
- Flyer Maker
- Graph Maker
- Invitation Maker
- Pitch Deck Creator
- Poster Maker
- Presentation Maker
- Report Maker
- Resume Maker
- Social Media Graphic Maker
- Timeline Maker
- Venn Diagram Maker
- Screen Recorder
- Social Media Video Maker
- Video Cropper
- Video to Text Converter
- Video Views Calculator
- AI Brochure Maker
- AI Document Generator
- AI Flyer Generator
- AI Image Generator
- AI Infographic
- AI Instagram Post Generator
- AI Newsletter Generator
- AI Quote Generator
- AI Report Generator
- AI Timeline Generator
- For Communications
- For Education
- For eLearning
- For Financial Services
- For Healthcare
- For Human Resources
- For Marketing
- For Nonprofits
- Brochure Templates
- Flyer Templates
- Infographic Templates
- Newsletter Templates
- Presentation Templates
- Resume Templates
- Business Infographics
- Business Proposals
- Education Templates
- Health Posters
- HR Templates
- Sales Presentations
- Community Template
- Explore all free templates on Piktochart
- Course: What is Visual Storytelling?
- The Business Storyteller Podcast
- User Stories
- Video Tutorials
- Need help? Check out our Help Center
- Earn money as a Piktochart Affiliate Partner
- Compare prices and features across Free, Pro, and Enterprise plans.
- For professionals and small teams looking for better brand management.
- For organizations seeking enterprise-grade onboarding, support, and SSO.
- Discounted plan for students, teachers, and education staff.
- Great causes deserve great pricing. Registered nonprofits pay less.
AI-Powered Poster Generator
With the Piktochart AI poster generator, you can turn any prompt into a gorgeous poster in seconds. No design skills? No problem. Just tweak it as you wish, then share your poster.
The new way of creating posters
Create in a Flash
Prompt to poster in 10 seconds
Say goodbye to complicated design steps. Simply type in your theme and watch as our AI poster maker transforms it into reality.
AI Image Generation
Bring your vision to life
Go stock photos and generate images that are contextualized to your needs with our advanced AI image generator. Put your creativity to the test and generate highly realistic images that make you stand out.

Create Without Limits
Where every idea finds its canvas
For events, marketing, learning, or personal creations, Piktochart AI delivers captivating poster designs for every need. Dive into a universe of impressive imagery tailored to suit any subject.

Create Your Vision
Piktochart starts, you put the finishing touches
Our AI sets the stage with a professionally crafted poster, then passes control to you, allowing you to modify and refine each detail to amplify your visual impact while keeping true to your brand.
Posters created using Piktochart’s AI-powered poster maker

Professionals like you use Piktochart’s free online poster maker to:

- Create eye-catching promotional materials that align with brand identity, ideal for advertising campaigns, product launches, and trade shows.
- Design captivating posters for corporate events, webinars, and conferences.
- Communicate new offers, services, or store openings.

HR & Internal Comms
- Internal announcements, motivational quotes, or event notifications.
- Job advertisements and onboarding materials to attract and welcome new employees.
- Convey important company policies and reminders through clear, engaging posters, ensuring better compliance and awareness.

NGOs and Government Organizations
- Develop impactful posters for awareness drives, fundraising events, and community outreach programs.
- Attract volunteers, highlighting the roles, benefits, and the difference they can make.
- Announce charity events, workshops, and seminars.

- Create informative posters on health topics, wellness tips, and medical advisories.
- Showcase healthcare services, specialist departments, and new medical technologies available at healthcare facilities.
- Display important health and safety protocols within healthcare settings.
How to Make a Digital Poster
1. Define Your Story
Briefly describe (within 120 characters) the purpose behind your poster. Whether it’s for promotion, making an announcement, driving awareness, or sharing health information.
2. Select from Our Varied Poster Designs
Jumpstart your project with our array of ready-to-use poster templates, perfect for shining a spotlight on any subject. After picking your preferred design, you’ll find yourself in our editing suite.
3. Tweak the Design with Piktochart Editor
With your template chosen, hitting the “Edit” button grants you entry into the Piktochart editor. This is your playground to adjust, alter, and align the design to reflect your personal touch and message.
4. Enhance with Visual Elements
Piktochart’s user-friendly drag-and-drop editor makes personalization a breeze. Tap into our rich collection of complimentary photos, icons, illustrations, and text options to craft a poster that stands out. Enhancing and tailoring colors is just a click away with our versatile design tool.
5. Publish and Promote
Once your poster is exactly as you envisioned, it’s time to save and share your work. Export in various formats like JPG, PNG, or PDF, catering to both digital platforms and print materials.
AI-Powered Visualization for Any Topic
What kinds of posters can be generated using this AI tool?
Navigating design elements and finding the right visual style can be daunting. With Piktochart AI, it’s easy to transform data into high-quality posters . Excellence made simple, just for you.
Event posters
Drum up buzz and awareness for an upcoming event. Piktochart AI transform dense data and information into engaging invitational posters for your events.
Advertising posters
Spark emotions that incite action – whether it is to make a purchase, improve brand opinion, donate to a cause, or make a lifestyle change. With Piktochart AI, it’s achievable at the click of a button.
Conference posters
Inform your audience with a glance about an upcoming conference. Whether it’s for a medical conference, marketing conference, or any conferences, Piktochart AI’s user-friendly poster maker helps you catch the attention of your audience effortlessly.
Ready to use AI to design posters like a pro?
Join more than 11 million people who already use Piktochart to create stunning posters.
Is it possible to personalize my poster with my own photos and diagrams?
What’s the limit on poster creation, how do i enhance the quality of my posters, is signing up mandatory to use piktochart, poster resources.

How to Make a Poster in 6 Easy Steps [2023 Guide With Templates]

25 Poster Ideas, Templates, and Tips for Creative Inspiration

Communications
7 Types of Posters and What Makes Them Stand Out
What else can you create with piktochart ai.
IMAGES
VIDEO
COMMENTS
Infographics. Level up your PowerPoint presentations with infographic design templates. Customize your own infographics right inside your PowerPoint decks to help take your presentations from merely telling to showing your ideas, plans, and successes. Conveying data to your audience is easier than before with these eye-catching templates.
Biology Infographics. Download the Biology Infographics template for PowerPoint or Google Slides and discover the power of infographics. An infographic resource gives you the ability to showcase your content in a more visual way, which will make it easier for your audience to understand your topic. Slidesgo infographics like this set here...
10. 20 Free Infographic Templates for PowerPoint. This huge infographic bundle with 539 slide templates includes 20 FREE infographics on different themes, such as business, steps, timeline, ecology, comparison, world maps, etc. All free templates are compatible with Microsoft PowerPoint and come in ppt/pptx file format.
How to Create an Infographic in PowerPoint. In the Design Tab, adjust the Slide Size to best fit your infographic. Select SmartArt from the PowerPoint navigation bar. Find a graphic that fits your data from the Process or Picture menu. Add or remove data points, time stamps, or other key information.
Go to Design tab > Slide Size > Custom Slide Size. We set our infographic to a 1:4 aspect ratio. You could make it 1:1, 1:2, 1:2.5, etc. depending on your needs. Note that resizing the canvas in PowerPoint is a little tricky. From our experience, it is better to ensure a bigger length and cut it off later.
Here are a few tips for creating an infographic: Research and settle on an infographic template. Set intentions and goals for your infographic. Identify the target audience for your infographic. Collect relevant data to include in your infographic. Download your template to PowerPoint or Canva. Personalize your infographic layout.
First, select the slide that you want to save as an image in the left-hand pane. A red box will appear around the slide when selected. Next, click File > Save As, and then choose the location you would like to save your infographic. Before clicking Save though, you'll want to change the file type it is saved as.
With this PowerPoint template, you can design infographic slides with 3D-like designs. It features 10 creative infographic slides with 3D cylindrical, pyramid, arrow, and many different styles of designs. You can also customize each slide to your preference in just a few steps. Business Growth - PowerPoint Infographics Slides
Choose an eye-catching palette but ensure that your graphic remains simple and readable. An infographic that's too busy might be hard to follow. You'll also want to consider your graphics and symbols. Consider breaking up your text with simple shapes and images that match your copy.
Use icons and shapes to create visual sections for each list item. On each slide, include 3 or 4 list items and create a visual continuity between all slides that visualize the list. Alternatively, use a custom size slide in PowerPoint to create a vertical list infographic with a portrait layout.
Presentations using infographics PowerPoint templates are a good option for capturing audience attention when explaining complex data. It is an easy to understand representation of data. The Business Infographics templates are the most popular among this category. In this category, you can download 100% editable infographic templates for presentations in PowerPoint and Google Slides.
Promote and publish your infographic. 1. Choose your desired infographic template. First things first, you have to choose an infographic template appropriate for representing your data. The important thing is to choose a template that specifically works for the type of data set/content you want to present.
In other words, stick with one transition pattern/direction, such as horizontal, to create a smooth flow between infographic slides. 2. Sketch a Wireframe. Awireframe is a rough pencil sketch of how your infographic presentation will look like. You don't need to be a design genius for creating a wireframe.
Infographics. Here you will find the best infographics for your Google Slides themes and PowerPoint presentations. They include charts, diagrams, and visual metaphors to illustrate your data and information. Charts & Diagrams Linear Processes.
Divided Into Categories for Easy Selection With 4,500 graphics to choose from, we made it extremely simple for you to find exactly what you are looking for. Each package is broken down into 165 unique categories, so you can discover the right infographic for any use. Trusted By Over 575,000 Clients Our infographics are used in boardrooms, on ...
How to Create an Infographic in PowerpointUsing no more than four columns and a template, you can easily design a great-looking infographic with Powerpoint.P...
Navigate to the SmartArt option. To add an infographic to your slide, you'll need to select a infographic template from PowerPoint's library. To find it, click on " Insert " > " SmartArt ". You should see options to add various infographic types like process infographics and list infographics.
Create captivating, informative content for PowerPoint in just a few minutes—no graphic design experience needed. Here's how: 1. Find the perfect PowerPoint template. Search for anything—type of template, image, color, —or take a look around by browsing the catalog. Select the template that fits you best, from pitch decks to data ...
In this PowerPoint tutorial, I have showed how to design an animated PowerPoint infogrphic slide. Here, to get the ultimate result, I have used two different...
See how it works. PowerPoint Add-in. Google Slides Add-on. These templates are AWESOME-- an essential add on to anyone who is bored with Powerpoint and Google Slides basic templates. In addition to being easy to use, a single click gets these templates to match your existing deck color scheme! So cool!
This free PowerPoint infographics template includes lots of useful timeline graphics for you to use in your presentations. There are 30 different timeline slides in total and you can easily edit them to customize the data. Free Design Thinking Infographics PPT. A must-have PowerPoint template for UX and design teams.
Free Google Slides theme, PowerPoint template, and Canva presentation template. How many planets are there in the Solar System? Eight! How convenient, because our new sets of infographics are composed of 8 blocks of information. Display your data in a professional way; whether it is in the form of a timeline, steps, a process or a roadmap, that ...
Features of these infographics. 100% editable and easy to modify; 30 different infographics to boost your presentations; Include icons and Flaticon's extension for further customization; Designed to be used in Google Slides, Canva, and Microsoft PowerPoint and Keynote; 16:9 widescreen format suitable for all types of screens
Whether you're mapping out key processes or illustrating operational steps, our minimalistic presentation template helps you convey complex data effortlessly. Ideal for team meetings, client presentations, or strategic planning, this PPT template is your go-to for clear and concise infographics. Transform your data into visually appealing ...
4. Enhance with Visual Elements. Piktochart's user-friendly drag-and-drop editor makes personalization a breeze. Tap into our rich collection of complimentary photos, icons, illustrations, and text options to craft a poster that stands out. Enhancing and tailoring colors is just a click away with our versatile design tool. 5.