

Install and Configure SSRS step by step
SQL Server Reporting Services (SSRS) is a server-based report generating software system from Microsoft. It is part of a suite of Microsoft SQL Server services, including SSAS (SQL Server Analysis Services) and SSIS (SQL Server Integration Services).
In this article, we will learn How to install and configure SSRS Native Mode step by step .
- 1.1 Install and configure SSRS Perquisites
- 1.2 Install SQL Server Reporting Services
- 1.3 Configure SQL Server Reporting Services
You might also like to read Install and Configure Power BI Report Server Step by Step
Applies To:
- SQL Server Reporting Services SSRS 2016.
- SQL Server Reporting Services SSRS 2014
- SQL Server Reporting Services SSRS 2012.
- SQL Server Reporting Services SSRS 2008.
How to Install and configure SSRS?
In this post, we considered that you have already installed SQL Server as mentioned at How to Install SQL Server 2012 Step by Step and How to install SQL Server 2019 Developer Edition .
Install and configure SSRS Perquisites
Before we getting started to Install and configure SSRS, you should prepare the following Prerequisites:
- Make sure that you have the same SQL Server version installation media that was used when the SQL Server is being installed.
- Create a new service account for Reporting Service. (Microsoft recommends to specify and use a separate account for each SQL Server service)
- Specify the authentication type and the account that has permission to connect to the database server. (Will be used during configuring the Report Server DB)
- Specify the authentication type and the account that the report server will use to connect to the report server database. (Will be used during configuring the Report Server DB)
- For the production environment, Don’t install SSRS on the database server, instead, you should create a new server for SSRS.
Install SQL Server Reporting Services
- Mount your SQL Server Media ISO/CD > Run SQL Server Installation file > From SQL Server Installation Center > Click on Installation.
- Click on New SQL Server stand-alone installation or add features to an existing installation.
- Click OK after the Setup Support Rules have been passed.
- Check Product Updates and click Next.
- Again, Check Setup Support Rules and click Next.
- From Installation Types > Check Perform a new installation.
- From Setup Role > Select SQL Server Feature Installation.
- Select Database Engine Services .
- Select Reporting Service -Native > Click Next.
- Configure instance by setting the instance name or leave default.
- Check Disk Space Requirement > Next.
- In Server Configuration > Set SSRS Service Account > Next.
- In Reporting Service Configuration > Check Install only .
- In Error Reporting > Click Next.
- Once the Installation Configuration Rules have been passed > Click Next.
- In Ready to install > Click on Install.
- Complete the installation wizard and click Finish.
You might also like to read Install and configure SSRS 2016
Configure SQL Server Reporting Services
- Open Reporting Service Configuration Manager.
- Click Find and select the existing instance that has been selected to add SSRS feature > Click on Connect.
- The Report Server Status should be shown with the current report server status and basic information about report server.
- Go to Service Account section to check the service account that has been set during the installation, you can also change the current service account through this section based on your requirement.
- Go to the Web Service URL section to configure the URL and port number for Report Service Web Service > Click On Apply to generate it.
- Got to Database section > Click on Change Database.
- Follow the Change Database wizard > Check Create a new report server database > Next.
- Select Authentication Type “SQL Server Account” > Set the Username and Password for the account that should have permission to connect to SQL server.
- Click on Test Connection > Next.
- Type your Database Name or leave it as default > Next.
- Again set the credential for the user that should have permission to access the Report Server Database.
- Review the Summary > Next.
- Wait until the Report Server Database Configuration wizard complete > Click on Finish.
- The Database section should show the current Report Server Database.
- Go to Report Manager section to configure the URL that will be used to access Report Manager. > Click on Apply.
- Try to navigate to the Report Manager URL to open Report Manager.
Note: in case you got any permission issue to open report Manager, please check
- SSRS Permission Issue: User does not have required permissions. Verify that sufficient permissions have been granted and Windows User Account Control (UAC) restrictions have been addressed.
- SSRS 2016: You are not allowed to view this folder. Contact your administrator to obtain the necessary permissions.
- Click on Report Builder to build your report.
- Click on Run.
- Great, the report builder is ready now to create your first report.
- Go now to Encryption Keys to take a backup of the symmetric key that used to encrypt sensitive data in the report server database like connection strings, credentials …etc.
Note: the symmetric key backup is very important especially in case of migrating or moving the report server installation to another server. you can restore this symmetric key to be able to access the encrypted content.
In conclusion, we have learned
- What’re the prerequisites to Install and Configure SSRS?
- How to Install and Configure SSRS step by step?
- Install and Configure SSRS 2016 step by step.
- How to Scale Out SQL Reporting Service (SSRS) to work with two Database Server (Always-on)?
- SSRS: Manage Permissions in Reporting Service .
Share this:
- Click to share on Facebook (Opens in new window)
- Click to share on Twitter (Opens in new window)
- Click to share on LinkedIn (Opens in new window)
5 thoughts on “Install and Configure SSRS step by step”
Pingback: Supported SQL Server Version for SharePoint 2016 | SPGeeks
Pingback: SSRS: SharePoint List does not exist | SP Geeks
very useful, thanks
Thanks for your feedback 🙂
great article
Leave a Reply Cancel reply
Subscribe to our newsletter.
Aenean massa feugiat imperdiet a scelerisque et morbi tempus massa tincidunt vitae libero aenean tincidunt molestie.

25 April 2014
421,531 views
SQL Server Reporting Services Basics: Building SSRS Reports
SQL Server Reporting Services is one of the most popular components of SQL Server, but it has always been surprisingly difficult to get from one place all the basic facts you need to get up and running from scratch, to the point of producing reports. Here Kathi Kellenberger quickly describes the basics of SSRS before showing how to build quick, simple reports.
SQL Server Reporting Services (SSRS) is a server-based reporting platform that allows us to create and manage a wide variety of different types of report, and deliver them in a range of formats. We can create basic reports containing tables and graphs, or more complex data visualizations, using charts, maps and sparklines. Our reports can draw their data from SQL Server databases, but also from other relational database such as Oracle, and other types of multi-dimensional or XML-based data sources such as SQL Server Analysis Services, Teradata, or Parallel Data Warehouse.
We can present our finished reports directly from the Reporting Services website, called Report Manager , or users can view them directly within their web- or Windows-based applications. End users can run reports on demand or schedule them as subscriptions. We can also install SSRS so that the reports run from SharePoint. This article is the first in a series that will provide in-depth coverage of the basics of report development with SSRS:
- Building SSRS Reports (this article) – covers the basics of SSRS, demonstrates how to build quick, simple reports, and will familiarize you with the basic Report Designer environment
- Customizing SSRS Reports (Part 2) – covers use of custom and aggregate functions, sub-reporting, the matrix control, drill-downs, and sorting.
- SSRS Visual Controls (Part 3) will take an in-depth look at the SSRS visual controls, notably the chart control.
- Deploying SSRS Reports (Part 4) walks you through deploying reports and the Report Builder tool
The report development examples in this series will work for SSRS 2008 R2 through 2012. Most of the examples will also work for 2008, and any I’ll call out any exceptions. If you are still using SQL Server 2005, please refer to Steve Joubert’s original SSRS series , upon which the example in this series are based.
SSRS through the ages
SSRS has been around for over 10 years, first shipping as an “add-on” for SQL Server 2000, and then fully integrated into SQL Server 2005. I first saw it demonstrated at the 2003 PASS Summit, and had the Beta version installed and running within a couple of days of getting back to work. Back in 2003, SSRS caused great excitement as it made available, for the first time, built-in reporting capabilities for SQL Server. If you owned SQL Server, you owned SSRS.
Since its integration into SQL Server 2005, Microsoft has made a number of improvements and added many new features. It had a big overhaul in 2008 and acquired a bunch of new features with 2008 R2 including:
- The tablix data region which allows us to convert a report area from a table to a matrix and back again
- Enhanced chart, and new gauge, data regions (thanks to the Dundas acquisition)
- Complete redesign of the Report Designer including a new Grouping Pane
- Formatting of text elements, not just at the textbox level
- Performance enhancements
- 2008 R2: KPIs, maps, sparklines, new functions, published Report Parts, and more
Since then, the basic features of the standard SSRS reporting tool haven’t changed. However, with SSRS 2012, Microsoft added Power View , providing a new way to create reports and geared towards business users. Power View is part of SSRS when installed in SharePoint integrated mode or as an add-in for Excel 2013. SQL Server 2014 was recently released, and there were no developer feature enhancements with this release.
SSRS Architecture
This series of articles focuses on the development of reports. Keep in mind that SSRS can be deployed to SharePoint, but this series of article only covers the native deployment architecture.
An SSRS deployment must be associated with a SQL Server instance. On the instance will be two databases, by default:
- ReportServer – contains the report definitions, configuration, history, security of deployed reports and more
- ReportServerTempdb – much like tempdb , it is used as a workspace for building reports and doesn’t maintain any objects permanently.
We will also need a location for the Report Server Web Service , which can be on the same server as the databases, as in the simple deployment architecture shown in Figure 1, or on a different server. On whichever server we choose, we will have access to a Report Manager website that allows us to deploy and manage the reports. End users can run reports from Report Manager, create subscriptions, and publish their own reports if they have permission.

The end user sends an HTTP request for a report, providing any required parameters. The SSRS server finds the metadata of the report and sends a request for data to the data sources. The data returned by the data sources is merged with the report definition into a report. As the report is generated, it is returned to the client.
Installing and Configuring Reporting Services
There are many ways to design a Reporting Services deployment for your department or company, with SharePoint integrated mode gaining popularity. However, since this series is focused on report development, it will cover native mode only, and just enough about installation and configuration to help you get things set up on your development computer.
To follow along with this series of articles, you will need to install the development tool and set up the SSRS services. If the SQL Server media is not available, you can download an evaluation copy of SQL Server 2014 .
SSRS installation
When running the SSRS installation, you will need to install the Database Engine and SQL Server Reporting Services in Native mode. It is easier to install both services at one time, because you can choose to have the installation process configure the SSRS services for you. If SSRS is installed later, or if you select not to configure it at installation, you will have to configure it manually. During installation, be sure to select these features:
- Database Engine
- SQL Server Reporting Services – Native (if installing 2008 R2, you’ll be asked on a subsequent screen to select the mode)
- Management Tools – Basic
- Management Tools – Complete
- Business Intelligence Development Tools or SQL Server Data Tools if available with the media you are using, which is dependent on the version
If given the choice, select Install and Configure .

SSRS Development Tools
Early versions of SQL Server used Business Intelligence Development Studio (BIDS) as the SSRS development tool. However, starting with SQL Server 2012, you will use SQL Server Data Tools – Business Intelligence (SSDT-BI), which may or may not be on the SQL Server media, depending on the version. Each tool runs as an add-in for Visual Studio. If you do not have Visual Studio in place, the BIDS or SSDT-BI installation will install a Visual Studio shell.
Naming confusion?
Just to add a little confusion, there is also an add-in called SQL Server Data Tools for Visual Studio 2012 . This is for database projects, not the BI tools that will allow you to create SSRS projects. It is not the option you want for SSRS development. You will also often see SSDT-BI abbreviated simply as SSDT.
The following table should help you navigate the options, understand the differences, and find the correct process for installing the development tool for your version of SQL Server.
SSRS configuration
If you were unable to let the installation process configure SSRS for you, or are installing SSRS after the initial engine installation, or maybe you decided to configure SSRS on your own for fun, you will need to launch the Reporting Services Configuration Manager .
As discussed, we need to associate SSRS with a SQL Server instance, where it can create the reporting databases ( ReportServer and ReportSereverTempdb ). When prompted, select the instance name and click Connect .

On the next screen, select the Database page on the left menu and click Change Database .

Select Create a new report server database and click Next . Enter the name of the SQL Server instance where you wish to create the reporting databases and click Next .

On the following screen, we configure the report databases. We can choose a different name from the default of ReportServer , if desired, but only do so if you have a good reason such as multiple instances of Reporting Services on the same server.

Continue clicking though the wizard and complete it. Once done, we need to configure the Report Server Web Service, so click the Web Service URL link.

Accept the defaults and click Apply . Finally, we need to configure Report Manager, so click the Report Manager URL link. Again, accept the defaults and click Apply .

Click Exit to dismiss the Reporting Services Configuration Manager.
Creating Basic Reports
Now that we’re all set up, it’s time to start building our first report. We’re going to build a report based on a ReportingDemo database. If you want to follow along, building the example report from scratch then you’ll need to create the database using the ReportingDemoDatabaseScript.sql script or, alternatively, by restoring the ReportingDemo.bak file, both of which you will find in the code file for this article (see the Code Download link at the end of the article ).
Alternatively, the download bundle also contains a copy of the completed SSRS project, FirstProject .
Using the Report Wizard
There are two ways to create SSRS projects within SSDT-BI. We can build the project manually, or we can get a kick start with the Report Wizard. Within the project we can create one or more reports. For example, we might have one project for all of the reports against a particular database, but that is not a requirement.
With the wizard, we can create only a relatively simple report, with one table or matrix data region containing text only.
Generally, the reports we create through the wizard won’t meet any but the most basic development requirements, but do not discount it entirely. It will allow us to get a report up and running with zero code and zero property setting, and the resulting report often makes a starting point for more complicated reports. Once we’ve created a report with the Report Wizard, we are free to modify it further as we wish, just as for a report we create from scratch, manually.
Our very first report project, FirstProject , demonstrates how to create a report with grouping levels including one of the dynamic features, collapsing and expanding sections. The report is essentially just a list of customers that we’ll group by state. The end result is not perfect, but it is a good start.
Open SSDT-BI and create a new project. Select the Report Server Project Wizard type. This will open up the New Project dialog. Create a new Reporting Services project called FirstProject . Click OK to start up the new report wizard. We can also kick off the wizard from within an existing project by right-clicking the Reports folder in Solution Explorer and selecting Add New Report .
The first dialog of note is Select the Data Source . Since this is our first data source, our only option is to create a new one.
Embedded versus Shared Data Sources
For the sake of this example, we will just create a new, embedded data source, which will be available only to the report in which it is embedded. However, a shared database source is available to all reports within a project, and once deployed, to any deployed report, from any project. If an existing shared data source exists, we should use it, and we have the option on this screen to make the current data source a shared data source. We’re going to set up a shared data source later in this article.
Select the New data source radio button and give the data source a name, usually referring to the database name, so in this case ReportingDemo . Leave the data source type as the default ( Microsoft SQL Server ).

Click the Edit button to bring up the Connection Properties dialog. Enter the name of the SQL Server instance hosting the data source, in this case the ReportingDemo database. The default option is to log on using Windows Authentication. If you are using SQL Server Authentication, choose that setting, and enter the username and password. Finally, select ReportingDemo and make sure you test the connection before you click OK .

Next up is the Design the Query screen. We can use the Query Builder by clicking the button at the top left but, in this case, simply enter SELECT * FROM Customer; into the Query string text box and click Next .
On the Select the Report Type dialog, we can choose between a tabular or matrix report. A tabular report is a traditional grid with column headings and rows of data, and it might contain grouping sections at the row level. A matrix report is like a pivot table. It can have column headings that expand across the top of the report. It can have grouping sections at the row and column levels. We’re going to start with a simple tabular report so choose Tabular and hit Next .
This brings up the Design the Table screen, where we specify what customer data we wish to include in our report, and how we wish to group it. Essentially, we need to specify how we will use each field (column) in the report. We might display some fields at the top of each page, use others for grouping, and others will form the detail level of the report.
In this case, we simply want to group the customer data by state, so select State in the Available fields box and click the Group button. If you group by more than one field, then make sure the fields are ordered (use the Up and Down arrows) to reflect the grouping level hierarchy you wish to see in the report. For example, State would be higher than City.
Add the other fields to the Details box.

On the Choose the Table Layout page, we have the choice of Stepped or Block . I don’t see a lot of difference between these layouts. After some experimentation, I found that the Stepped report had a row dedicated to the group label and that row was formatted with a background color. The Block report shows the group label on the first row of the detail and no special background. With the Block report, we do not have the option for drilldowns.
Select the Stepped option and check the Enable Drilldown checkbox, which will allow us to collapse and expand the data by state (the grouping column)
On the next screen, choose a style for your report (I chose Ocean).
The Choose the Deployment Location screen allows us to specify the Report Server to which we wish to deploy the reports in the project. For now, we will be working within SSDT-BI and not deploying the reports to the server, so we can just accept the defaults. When we are ready to deploy the reports, we can revisit these settings by right-clicking the project name and selecting Properties .

This brings up the final screen, Completing the Wizard , which simply summarizes our chosen report options, and lets us name the report and preview it. Name the report ReportWZ and click Finish to end the wizard.

After the wizard completes, we will see the report in the Design tab of the standard Report Designer.

Click on the Preview tab to view the report. The Preview tab allows us to run the report from SSDT-BI, without having to publish it first to the Report Server. If the report takes parameters, the Preview tab will ask us to fill them out before it runs the report. Since this report doesn’t take any arguments, it will display immediately.

Use the +/- symbols next to the State abbreviations to expand and collapse the grouping of the report.
Manual report creation
Whilst the FirstReportWZ report is simplistic, it does demonstrate how quickly we can generate reports using the Wizard, which is often useful for prototyping.
In this section, we are going to create another simple, but more realistic, report from scratch. It will demonstrate how to create and use a shared data source object, stored procedures, and how to format the report, set report properties and use report parameters.
Create a shared data source
A shared data source is a data source that is common to, and can be used by, all of the reports in the project. Once the shared data source is published to the report server, any published reports can use it.
In the previous section, we created a Report ing Demo data source that is embedded in the ReportWZ report, and so is available only to that report. However, generally, it is a bad practice to use embedded data sources. Let’s say we have 20 reports that access the ReportingDemo database, but a few months later some aspect of the connection information changes (such as the login credentials, or server name). We’ll have to open all twenty reports and edit the connection information appropriately. It is much better to define a single shared data source that all reports that need the ReportingDemo database can use.
Likewise, let’s say that our organization has deployed three SSRS sites: Development , Test and Production . If we embed the connection information in the report, we will have to change the data source properties each time we publish the report to Development, Test or Production. If we use a shared data source, the data source will be configured appropriately on each of three sites. We can configure a data source on each site with the same name but pointing to the appropriate servers. We can simply publish the reports to each site, and the reports will automatically use the connection information associated with that environment.
We can find in SSDT-BI’s Solution Explorer all the reports and other project-level objects. To add a new shared data source to the project, right-click on the Shared Data Source s folder and select Add New Data Source and then simply create a ReportingDemo data source exactly as described in the previous section. It’s not possible to edit the existing embedded data source to make it a shared one. We have to define it as a shared data source upon creation.

Add a new report
We’re now going to create another report to return customer information. In the previous example, we used a simple SELECT * query to define the data set for the report. Here, we’ll use a stored procedure. In this first example, we’ll use a basic stored procedure with no parameters, but later we’ll refine it to add parameters, and allow end users to filter the report data by parameter value (e.g. to view customers only from a particular state).
When creating a new report manually, we must always follow this sequence of steps before we can begin to add data-connected objects:
- Add the report
- Create a data source in the report, preferably pointing to a shared data source
- Create a dataset that points to the data source and contains your query
First we add the report to the project. From the menu select Project | Add New Item (or right-click on FirstProject in solution explorer). Select Report , name it FirstR eportMan.rdl and click Add . The new report will open up in Report Designer tool, at the Design tab.
Second, we define the database for the FirstReportMan report. On the left, you will see the Report Data window, used to manage the data sources, datasets and parameters of our report. At the top of the Report Data window, choose New | Data Source… from the dropdown list, which will open the Data Source Properties window, where we can either create a new embedded data source or point to a shared data source. We’ll change the name of the data source to ReportingDemo and select the Use shared data source reference option, selecting the ReportingDemo shared data source from the dropdown list.

Third, we create the Dataset . While the data source is the connection string, the dataset is the query definition. In this example, our dataset is a very simple, parameter-less stored procedure called spr_CustomerSelectAll and all it does is select all of the columns from the Customer table. The ReportingDemoDatabaseScript.sql script, in the code download, includes the code to create the stored procedure.
From the Report Data menu, choose New | Data Set… to open the Dataset Properties dialog. We can create a shared dataset or a dataset embedded in the report. Most of the time, the dataset will be embedded in the report. There are some exceptions to this, for example, when we have a parameter list we use in multiple reports. Name the dataset Customers and choose to embed the dataset in the report. Select the ReportinDemo data source from the dropdown. Select StoredProcedure as the command type, and choose spr_CustomerSelectAll in the stored procedure list.

We can repeat these steps to add multiple datasets to the report, but for now we only need the one.
Designing the report
As we’ve noted previously, at the top of the Report Designer window are two tabs: Design and Preview . The Design tab is the physical Report Designer where we design the report i.e. set up the data presentation of the report itself, plus any header and footer for the report pages.
Design the Report table
Let’s start by designing the basic report table. Click to Design tab of our FirstReportMan report. We’re going to build a tabular report, so we start by dragging a Table control from the Toolbox window, onto the body of the report. By default, the table shows a header row at the top, and a data (or detail) row at the bottom.
In the Report Data window, expand the Customers dataset, select FirstName and drag it to the first cell of the detail row of the table, then drag LastName into the second column, and CustomerStatus into the third. When we drag each column into the data row of the table, SSRS make a guess as to what to call the row in the corresponding header. We can expand and shrink the size of the columns by highlighting and dragging.

We can add additional columns to the table by right-clicking on one of the columns and selecting one of the two Insert Column options. We’ll add the DateOfBirth column to the report, so add a new column to the right of CustomerStatus , and then drag the DateOfBirth field from the dataset to the detail row of the new column. Alternatively, we can hover over the cell to see a popup list of fields from the dataset, and select D ateOfBirth

At this stage, we can click on the Preview tab to view the report.
Format the table header
Now we have a basic, very plain, tabular report, so let’s add some formatting to make it look better. We have lots of options such as adding background colors, changing the font or text color, adding italics or bolding, and more. In this example, we will change the background color of the header row.
To format all the cells in the header in the same way, click one cell to make the table handles appear. Then select the entire row by selecting the handle:

There are two ways to modify the properties. The first is to open the Properties window (F4), where we can set background color, font, and so on. The other method is to use the formatting toolbar. Whichever way you choose, set the background color for the headers to your preferred color and choose the bold font style.

Having formatted the header row, we can once again click on the Preview tab to view the report.
Add a Page header
We’ve worked on the table header, but the report page itself can also have a header and footer. Report headers and footers appear on every page of the report. To add one, move to Design mode and select Report | Add Page Header from the menu. A new band appears on the report above the body. From the toolbox, drag a text box onto the header, click on it and enter your header, “My First Report”. Select the textbox and modify the font and text style, as desired. Again, we can check our handiwork in Preview mode.

Starting with the 2008 release, as well as applying formatting to a textbox, we can also apply multiple formats to the text within a textbox. Clicking the edge of the textbox selects the textbox. Clicking inside the textbox selects the text. To try this, go back to the design view and select just part of the text in the “My First Report” textbox and apply different formatting, such as a different font. Now there are two formats within one textbox.
Field Formatting
We can apply formatting to each detail field in the report table. Let’s start by beautifying that ugly DateOf Birth field. The time information is superfluous, so let’s format the date properly. Right-click on the cell that contains the date of birth, choose Text Box Properties . Next, navigate Number | Date and then set the preferred format (I used yyyy -mm- dd ).

Setting report level properties
When on the Design tab of the Report Designer a top menu item, Report , activates, from where we can:
- Turn on and off the header and footer sections for the report pages
- Open the Report Properties dialog and set various report properties, such as the print format
- Publish report parts – starting with 2008 R2, you can publish individual part of the report that can be used to build dashboards (we won’t cover this till later in the series)
- View the grouping section and ruler . For example, if the ruler is not visible, turn it on from Report | View | Ruler .
Navigate Report | Report Properties to open the Report Properties dialog. Some of the report properties are also available in the Properties (F4) window as well, but you may find that working in the Report Properties dialog is more convenient.
Setting up the report print settings is not intuitive, compared to other products. In the report Design tab you see your report with a ruler across the top. Since I am in the US, my ruler is set up in inches by default. A standard sheet of paper is 8.5 x 11 inches. The default setting in SSRS is to have a 1-inch (or 2 cm) margin all the way around the content area. So, at 8.5 inches wide with a 1-inch margin on the left and another on the right, we have 6.5 inches for content. If the report page is wider than 6.5 inches, it will spill over onto a second sheet of paper when printed. If there is just blank space in the extra area, you will get alternating blank sheets of paper when printed.
On the Page Setup tab of the Report Properties dialog, we can change the report to Landscape if we wish, switch to centimeters, modify the paper size or the margins. To avoid spill-over when printing, make sure that the width of the report plus the right margin plus the left margin is less than the width of the paper size.

Adding parameters to a report
There are two ways to add parameters to our reports. The first is simply to define parameters in the queries in the dataset, and then these will automatically be available as report parameters. The second way is to manually add report parameters through the Parameters section of the Report Data window.
We can use parameters to filter the data at the source, or for other reasons like giving the end-user control over one of the properties. We could also have a parameter that is used for both functions.
Parameters created by the dataset query
First, we will set up parameters using a dataset query. You can either continue working with the same report or create a new one that is a copy of the original.
To create a copy, right-click on FirstReportMan in the Solution Explorer and select C opy . Then right-click on the project name and select Paste . Rename the new report ParameterReport . Double-click the new report in Solution Explorer to open it in the designer. In the Report Data window, navigate to the Customers dataset and double-click it to bring up the properties. The Dataset dialog box opens and allows us to edit the query for the dataset. Change the stored procedure from spr_CustomerSelectAll to spr_CustomerSelectByState . A parameter called @ StateCD should appear in the Parameters folder. This parameter allows us to filter the data from the Customer table by State . Again, the ReportingDemoDatabaseScript.sql script in the code download includes the creation script for spr_CustomerSelectByState .
Switch to the Preview tab to view the report. Instead of the report just running and displaying all the data from the data source, there should be a place for us to enter a value for the @ StateCD parameter. Enter “CA” and click the View Report button to see only Californian customers.

To edit existing parameters, or to add new ones, switch to the Design tab of the Report Designer and expand the Parameters folder. Double-click the StateCD parameter to bring up the properties. First, we are going to make the prompt a little more friendly. On the General page, change the Prompt value to State .
We can also provide a list of possible values for the parameter. Select the Available Values page and from here we can provide either a hard-coded list, or connect the parameter to a dataset. The second method is the generally the best so that we can avoid the need to maintain the list manually.
Close the parameter properties. To connect a parameter to a dataset, we first need to create a new dataset. Using the skills you have learned so far, add a dataset to the report called StateList based on this query: SELECT DISTINCT State FROM Customer ORDER BY State ; .
Open the parameter properties once again and select Available Values . Choose Get values from a query. Under Dataset , select StateList . For the Value and Label fields, select State .

In this case, the Value and Label fields are the same. The Value field is the field that the database needs for the query. The Label field is the field that the end user should see. For example, if we have a list that has an ID and a description, the ID would be the Value field while the description would be the L abel field.
Manually created parameters
Tip: shared data sources, embedded datasets.
Generally, data sources are best shared and datasets are best embedded. However, queries to populate parameter lists are good examples of datasets you may want to share instead, since they can often be used for several reports.
Now let’s add a parameter that is not defined in a query and, therefore, must be created manually. In the Report Data window, click Add | New Parameter . Give the new parameter the name ReportTitle , and enter “Report Title” for the Prompt . Its data type should be Text . Click OK .
Back on the Design tab, right-click the report header textbox and choose the Expression option. Remove the original “My First Report” text and select Parameters under Categories . Double-click on the ReportTitle parameter. This text box will now display the value we pass to the Report Title parameter. Click OK .

Switch to the Preview tab and try it out.

Part 1 covered everything we need to build a basic SSRS report. In the next articles, we’ll get into more advanced options such as grouping, drill-downs, sorting and custom functions. Stay tuned.

SQL Monitor helps you manage your entire SQL Server estate from a single pane of glass. Proactively mitigate potential risks with instant problem diagnosis and customizable alerting – wherever your databases are hosted. No downtime, customer complaints, or wake-up calls at 3am.
Find out more
Subscribe for more articles
Fortnightly newsletters help sharpen your skills and keep you ahead, with articles, ebooks and opinion to keep you informed.

Kathi Kellenberger
Kathi Kellenberger is a Customer Success Engineer at Redgate and a Microsoft Data Platform MVP. She has worked with SQL Server for over 20 years and has authored, co-authored, or tech edited more than 20 technical books. Kathi is a volunteer at LaunchCode, the St. Louis based organization providing free training and paid apprenticeships in technology. When Kathi isn’t working she enjoys spending time with family and friends, cycling, singing, and climbing the stairs of tall buildings. Be sure to check out her courses on Pluralsight .
Follow Kathi Kellenberger via
View all articles by Kathi Kellenberger
Load comments
Related articles

Introduction to SQL Server Spatial Data
- T-SQL Programming

Power Query Formula Language in Power BI Desktop

What’s new in T-SQL in SQL Server 2022

A Guide to Installing SQL Server 2008 R2 Reporting Services
Basit Aalishan Masood-Al-Farooq , 2012-02-14
Introduction
In this article, I will discuss SQL Server 2008 R2 installation setup which you can use to install and configure Microsoft SQL Server 2008 Reporting Services. The most of the installation process is managed by the Setup.exe installation wizard, so expect to be prompted for a number of configuration options that determine how, where, and whether each segment of the Reporting Services package will be installed. As we know that there are a variety of ways to install Reporting Services, so I've tried not only to address the common case, but also provide hints and techniques to be used for some of the more sophisticated installation scenarios. In this article I will be covering following sections:
- Installation Prerequisites and Preparation for Installation: This section discusses things you need to consider for the installation of Reporting Services.
- Installing Reporting Services on a Server: This section walks through the Setup wizard and discusses how to respond to each dialog.
- After Installation Configuration: This section discusses the use the Report Server Configuration Manager to configure and start newly installed Reporting Services instance.
- Verifying and Securing Reporting Services Installation: In this section we will first verify Reporting Services installation by connecting to report manager and then we will show how to secure your Reporting Services Manager.
The procedures described are for a non-clustered server, and can be applied either to a default instance or a named instance. This document is concerned with building a dedicated Reporting Services instance, with the databases on a remote server.
Installation Prerequisites and Preparation for Installation
Reporting services 2008 can be installed on the following microsoft operating systems:.
Server operating systems include:
- Windows Server 2003.
- Windows Small Business Server 2003.
- Windows 2000 Server.
Workstation operating systems include:
- Windows XP Professional.
- Windows 2000 Workstation.
Web server & Web browser:
Internet Explorer 7, Internet Explorer 6 with SP2 or above.
Preparing for Installation:
You should have two domain accounts created, one for the Reporting Services Account. The account should be removed from the Domain Users group and any other domain and local groups that would grant them unnecessary permissions. In particular, this account does not need to be members of the local Administrators group and should be assigned the Deny log on locally privilege.
You should attempt to log on as the accounts created above in order to verify that the Deny logon locally right has been assigned.
You must also have a SQL Server 2008 server that will hold the Reporting Services databases. The server should have the TCP/IP and Named Pipes protocols enabled.
Installing SQL Server™ 2008 R2 SSRS Instance
Before starting your SQL Server installation, please follow these steps:
Configuring Reporting Services Instance
After installing Reporting Services, use the Report Server Configuration Manager to configure and start Reporting Services. The Report Server Configuration Manager has a number of pages that you can use to configure Reporting Services. Each page name is shown in the page menu. If the icon next to the page name is green with a check mark, the items on the page are configured correctly. If the icon has an X, the items aren’t configured correctly.
Verifying and Securing Reporting Services Installation
Report Manager is installed during setup on the same computer as the report server. You should verify that you can connect to the Report Manager.
Working with a new piece of technology can be intimidating. Not having the technology installed correctly can only lead to more difficultly. In this article outlines steps to properly install, Configure and Secure SQL Server 2008 R2 Reporting Services instance. The installation step described in this article is for a non-clustered server, and can be applied either to a default instance or a named instance. This document is concerned with building a dedicated Reporting Services instance, with the databases on a remote server.
3.58 ( 19 )
Log in or register to rate
You rated this post out of 5. Change rating
- SQL Server 2008
Join the discussion and add your comment
Related content

Using SQL Server 2008 Reporting Services with SAP NetWeaver Business Intelligence
- by Additional Articles
- Microsoft MSDN
This paper discusses the integration of SAP NetWeaver BI ® with Microsoft ® SQL Server ® 2008 Reporting Services (SSRS). The paper provides an overview of using the Reporting Services SAP Netweaver BI data provider and related query designer, to build high quality reports against SAP NetWeaver BI sources. For Reporting Services users who are new to working with SAP NetWeaver BI, this paper will help you connect and build datasets. For users already familiar with SAP NetWeaver, the paper will show how some of that system’s notable features can be leveraged in Reporting Services reports. It also presents some tips and tricks that can help you make the most of the integration between the two products.
2,111 reads
What's new in SQL Server 2008 Reporting Services?
- SearchSQLServer
New features in SQL Server 2008 Reporting Services mean improved charting and increased memory. Learn more about SSRS performance upgrades in SQL 2008.
4,708 reads
UPSERT Functionality in SQL Server 2008
- Database Journal
This article illustrates the functionality of UPSERT via the MERGE command in SQL Server 2008.
6,046 reads
Microsoft SQL Server 2008 - Change Data Capture – Part 2
Part 2 of this article illustrates how to enable Change Data Capture on a database, on a table and how SQL Server tracks the data changes of the CDC enabled table.
2,718 reads
SQL Server 2008 - Table Valued Parameters
In this screencast, we look at Table Valued Parameters from both the server side and client side perspectives.
2,499 reads
- Latest Articles
- Top Articles
- Posting/Update Guidelines
- Article Help Forum
- View Unanswered Questions
- View All Questions
- View C# questions
- View C++ questions
- View Javascript questions
- View Visual Basic questions
- View Python questions
- CodeProject.AI Server
- All Message Boards...
- Running a Business
- Sales / Marketing
- Collaboration / Beta Testing
- Work Issues
- Design and Architecture
- Artificial Intelligence
- Internet of Things
- ATL / WTL / STL
- Managed C++/CLI
- Objective-C and Swift
- System Admin
- Hosting and Servers
- Linux Programming
- .NET (Core and Framework)
- Visual Basic
- Web Development
- Site Bugs / Suggestions
- Spam and Abuse Watch
- Competitions
- The Insider Newsletter
- The Daily Build Newsletter
- Newsletter archive
- CodeProject Stuff
- Most Valuable Professionals
- The Lounge
- The CodeProject Blog
- Where I Am: Member Photos
- The Insider News
- The Weird & The Wonderful
- What is 'CodeProject'?
- General FAQ
- Ask a Question
- Bugs and Suggestions
Install and Configure SQL Server Reporting Services (SSRS)

What is SQL Server Reporting Services (SSRS)?
SQL Server Reporting Services (SSRS) provides a set of on-premises tools and services that create, deploy, and manage reports. You can design reports using data, tables, graphs, charts, and images. You can easily deploy reports on the local or remote server.
Pre-requisites
- Microsoft SQL Server installed on the machine (please check my article to install SQL Server here ).
- Configure Named Pipe and TCP/IP Settings if your SQL Server Database Engine Instance is hosted on another machine (please check my article here ).
Install SQL Server Reporting Services (SSRS)
Let us install and configure SQL Server Reporting Services on the local machine.
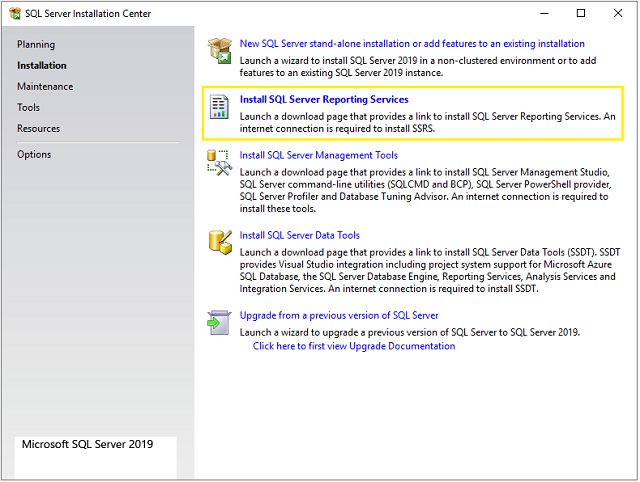
Let us first download installation media for SSRS. To download compatible installation media, first run SQL Server Setup as shown in this article . Go to the Install SQL Server 2019 Developer Edition section of the article and follow steps 1 and 2. You will see the below screen. Now click on the Install SQL Server Reporting Services link and it will launch a download page for SSRS. Download installation media for SSRS report from that page.
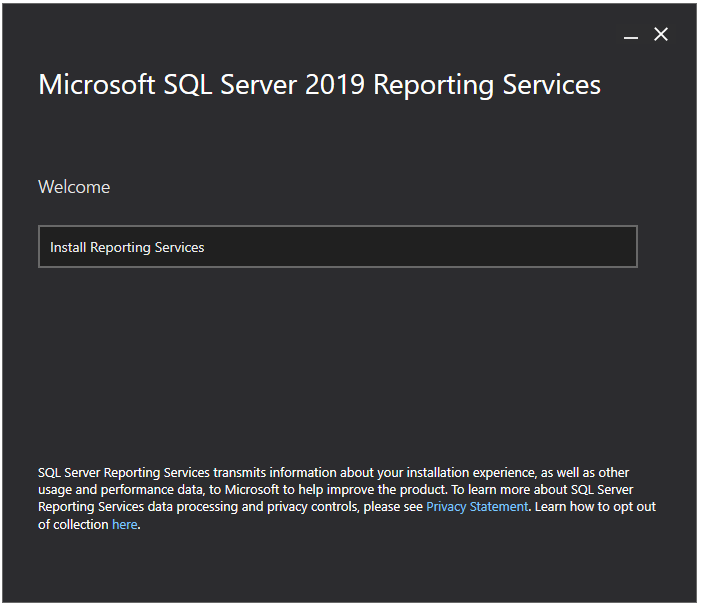
Now double click and run the downloaded installation media. You will see the below screen. Click on the Install Reporting Services button.
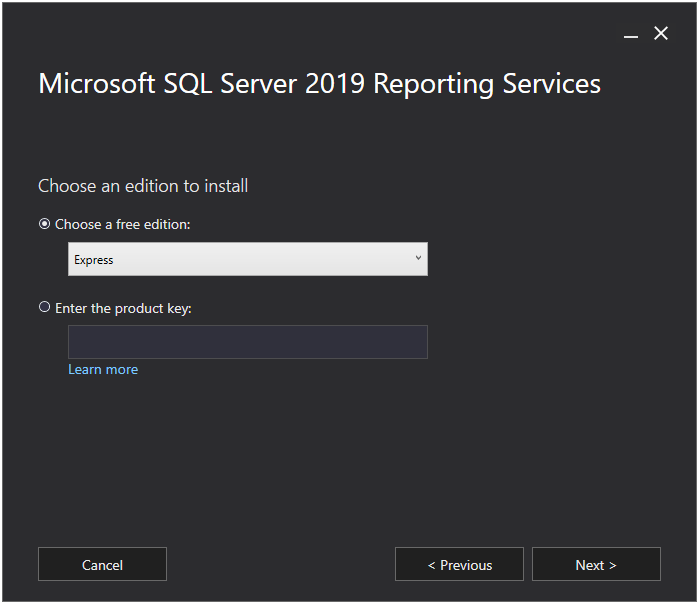
Next, you will see the below screen. Choose Express or Developer edition from Choose a free edition dropdown and click on the Next button.
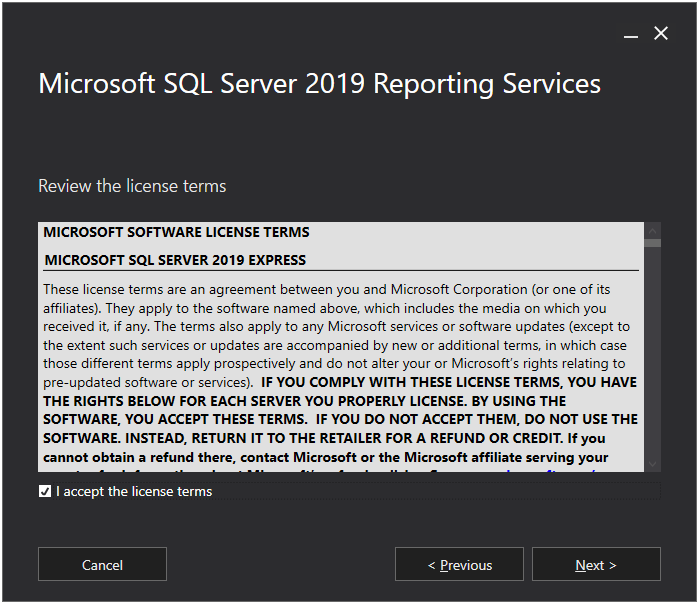
On the next screen, simply accept the license terms and click on the Next button.
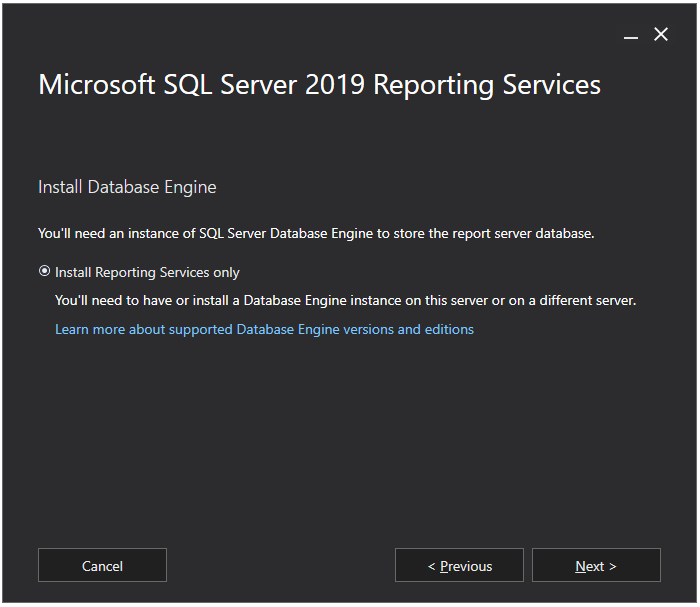
Now Install Reporting Services only option is already selected so just click on the Next button.
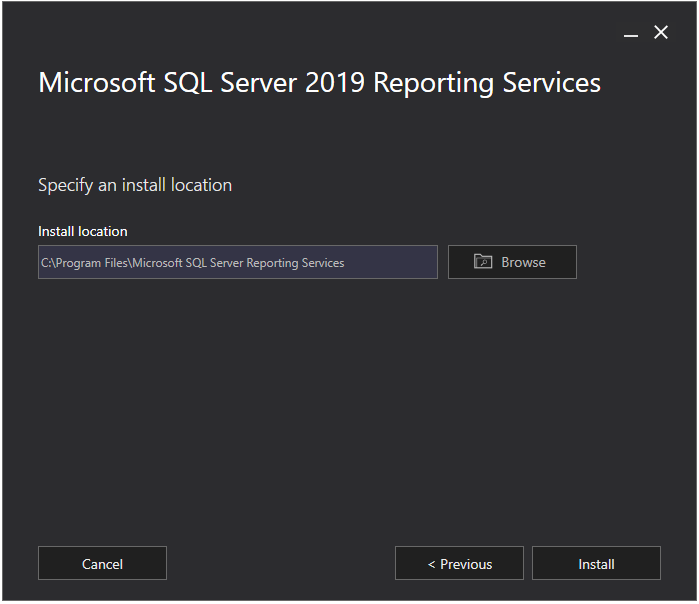
Choose the installation location of your choice. I will go with the default location. Click on the Install button.
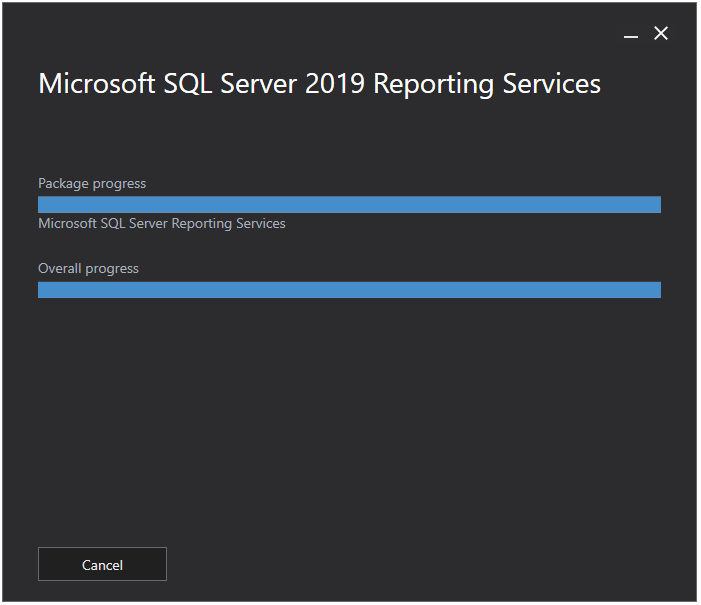
It will start the installation of SSRS which will take some time.
Once the installation is finished, click on the Configure report server button, or if you want to install it later, simply click on the Close button.
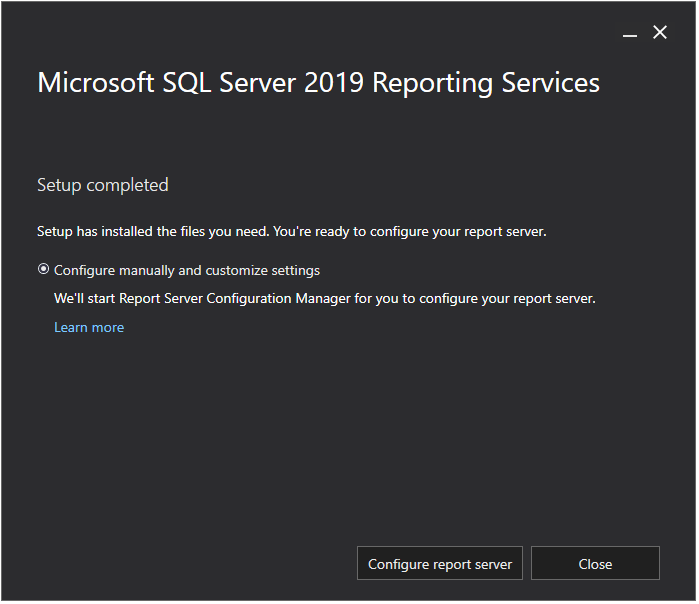
Great! We have successfully installed SQL Server Reporting Services. I recommend restarting your machine before configuring it.
Configure SQL Server Reporting Services
Now that you have installed SQL Server Reporting Services, let us configure it.
Open Report Server Configuration Manager from the Start menu.

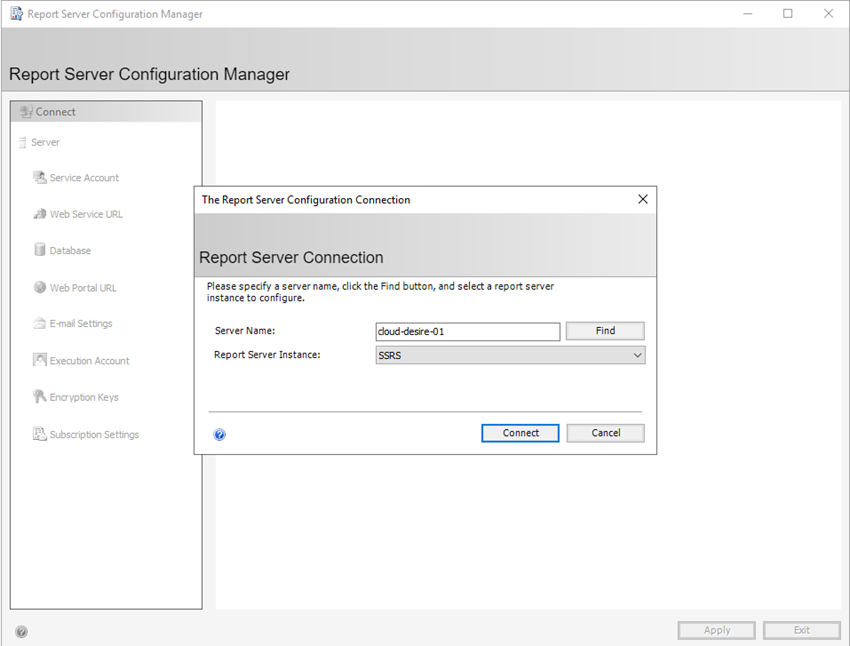
Next, you will see the configuration wizard. First, you need to connect an SQL server instance for which you want to configure SSRS. Select an instance and click on the Connect button.
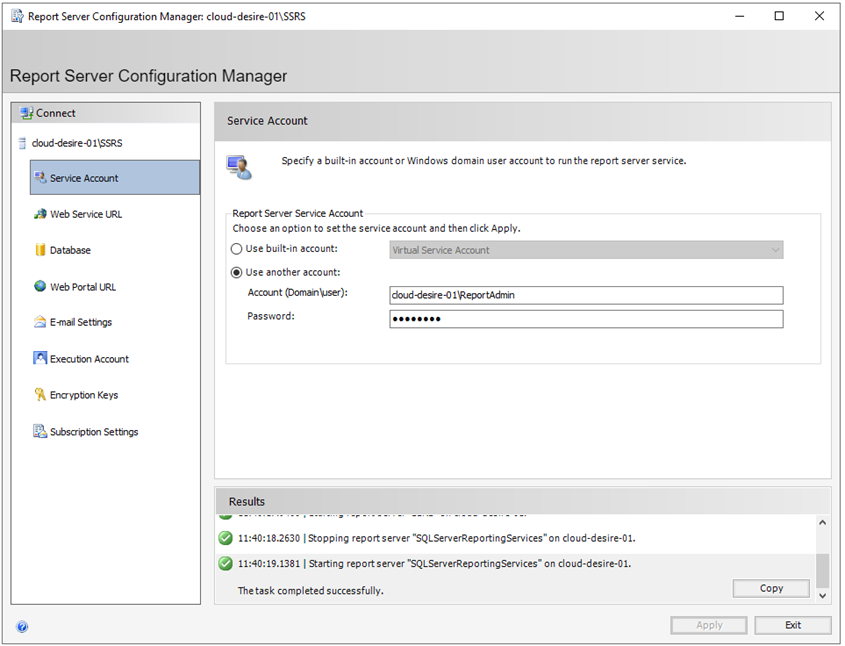
Next click on the Service Account tab from the left panel. You will see the service account configuration window. Specify windows account to run the report server service. I recommend creating a new dedicated user with administrator privileges for this. I have created one with the name ReportAdmin . Enter your account and password and click on Apply button. It will configure the service account.
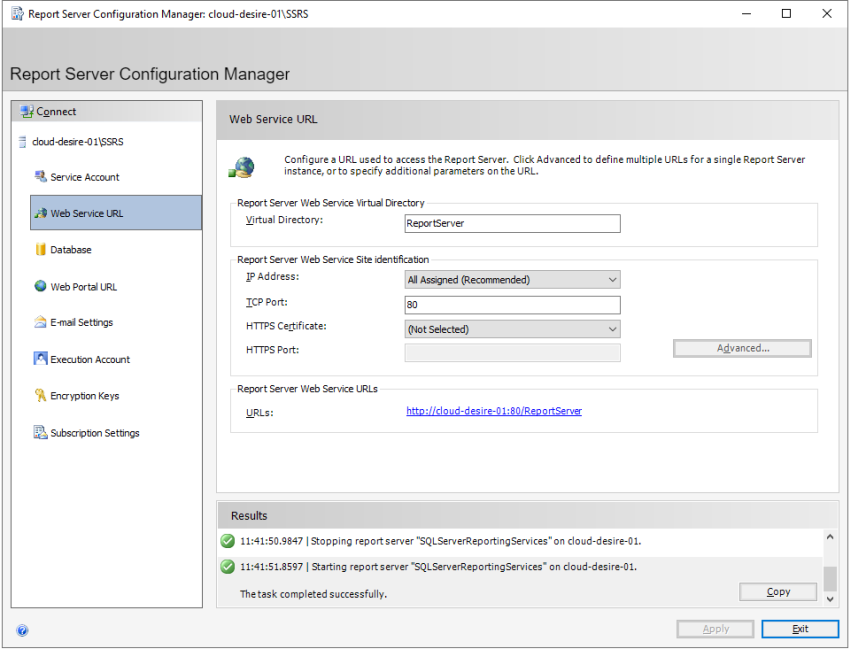
Next click on the Web Service URL tab from the left panel. Here, you can configure the report server URL. We will use this URL to deploy SSRS reports on the report server. You can also configure ports (80 or 443 (SSL)) on which the report server will host. It will preview URLs in the bottom section. I will go with default settings. Click on the Apply button and it will configure the report server web service URL.
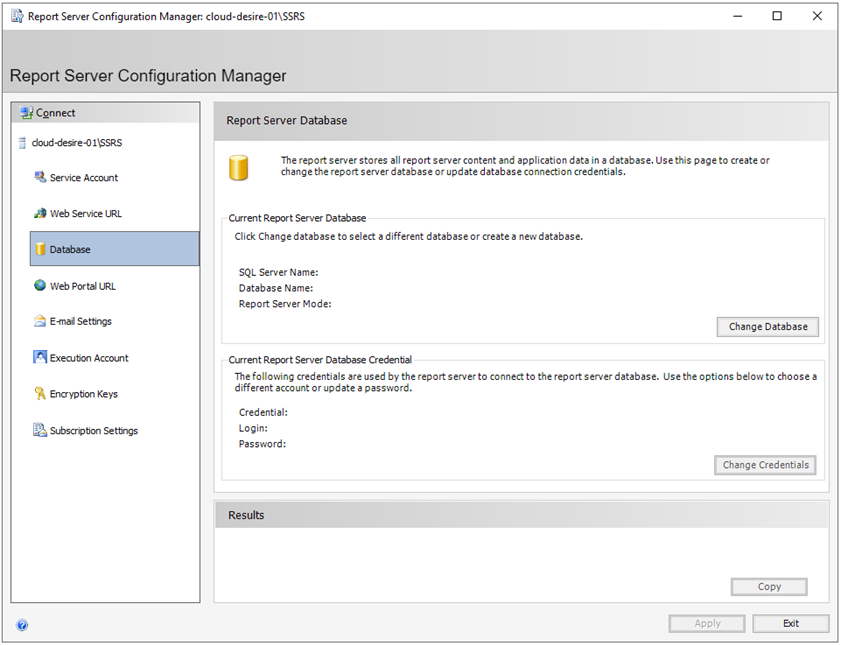
Next click on the Database tab from the left panel. Here, we will configure the database for the report server. Click on the Change Database button.
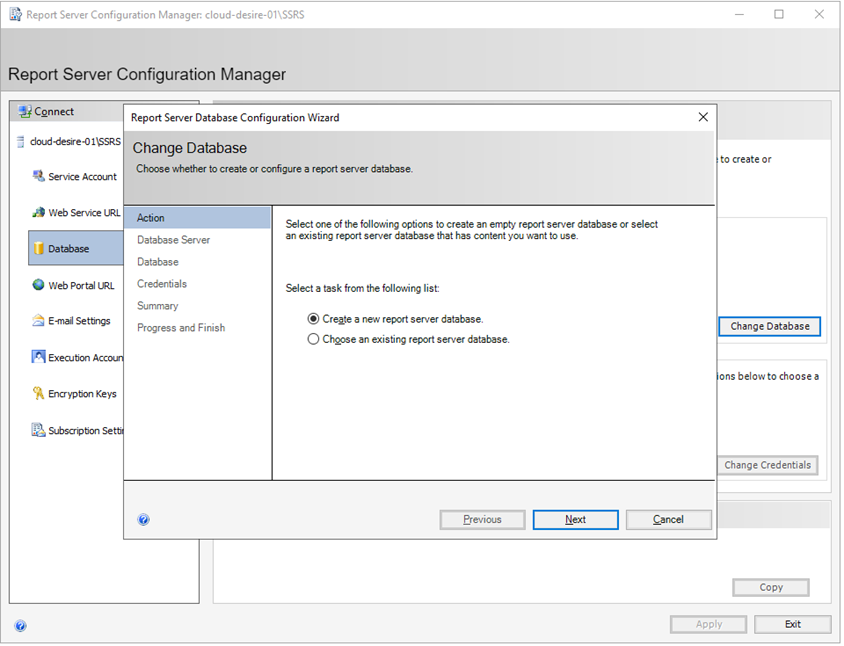
You will see Report Server Database Configuration Wizard . We are going to create a new database but if you have already an existing database for the report server, you can also configure it. For now, I will create a new report server database. Select the first option and click Next .
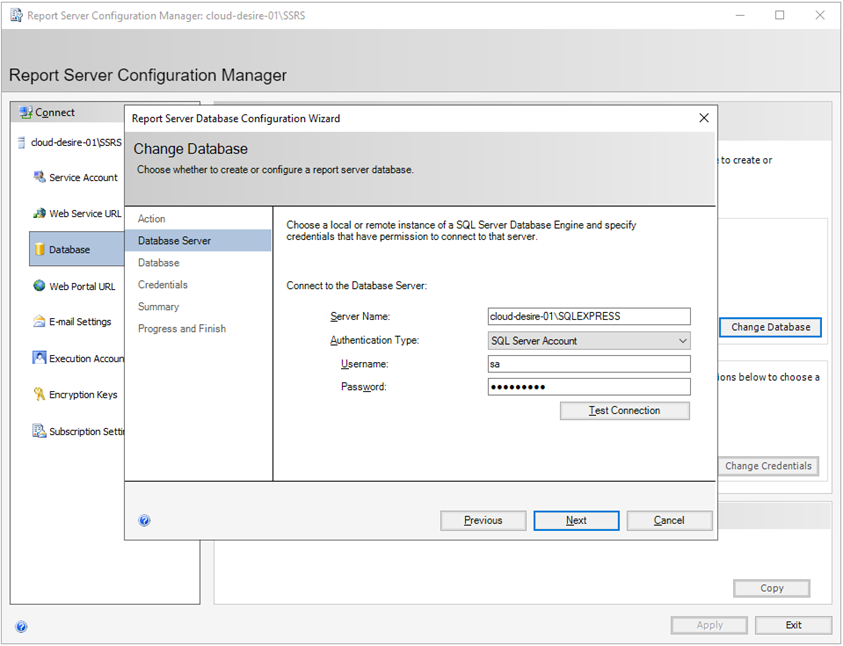
Now specify details to connect SQL Server Instance on which you want to create report server database. I will go with my local instance and use SQL Server Account authentication. Click the Test Connection button. If the connection is successful, click on Next .
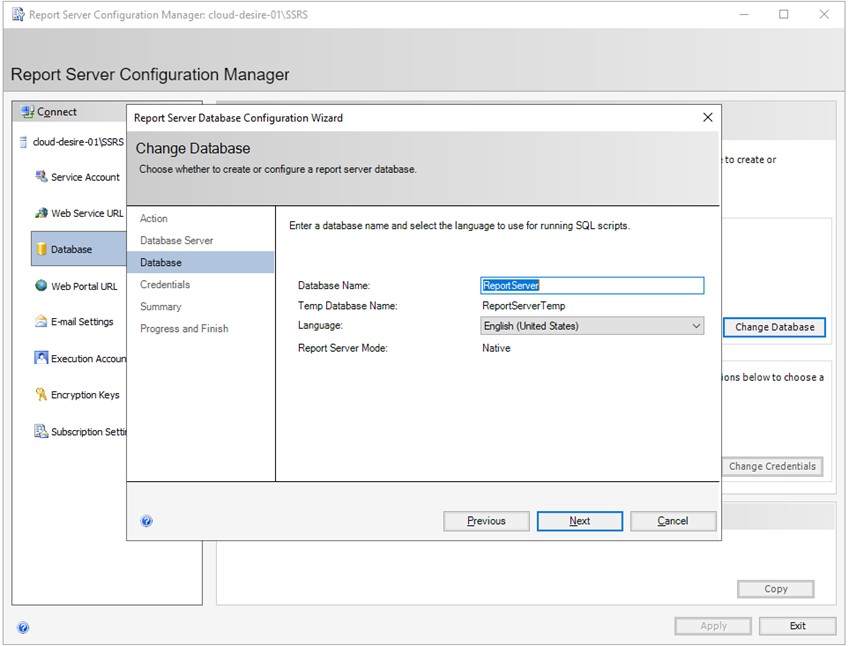
Now specify the database name and click Next .
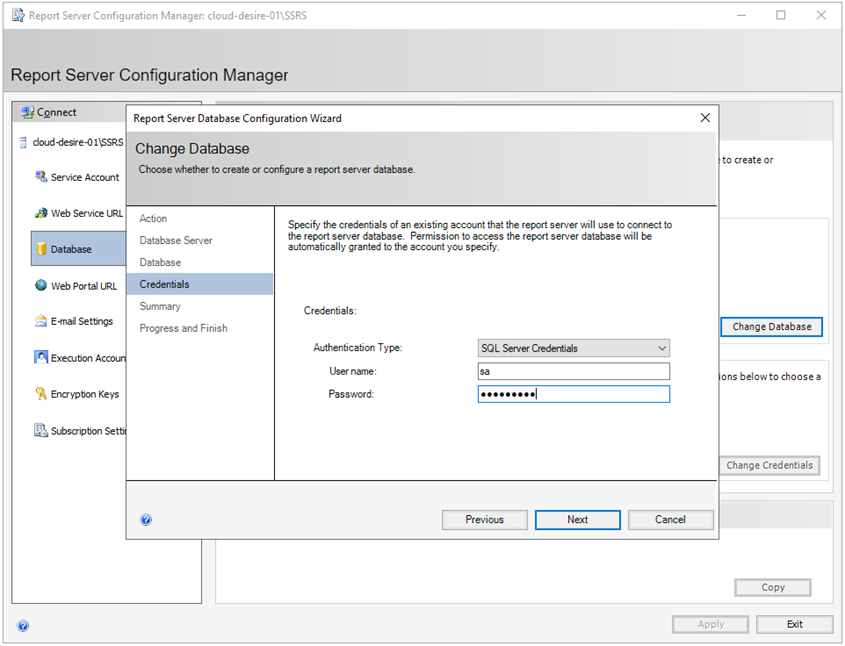
Now specify the credentials to connect to the report server database. I will again use SQL Server authentication. Click Next .
Next, you will see a summary of your selected settings. Verify and click on Next .
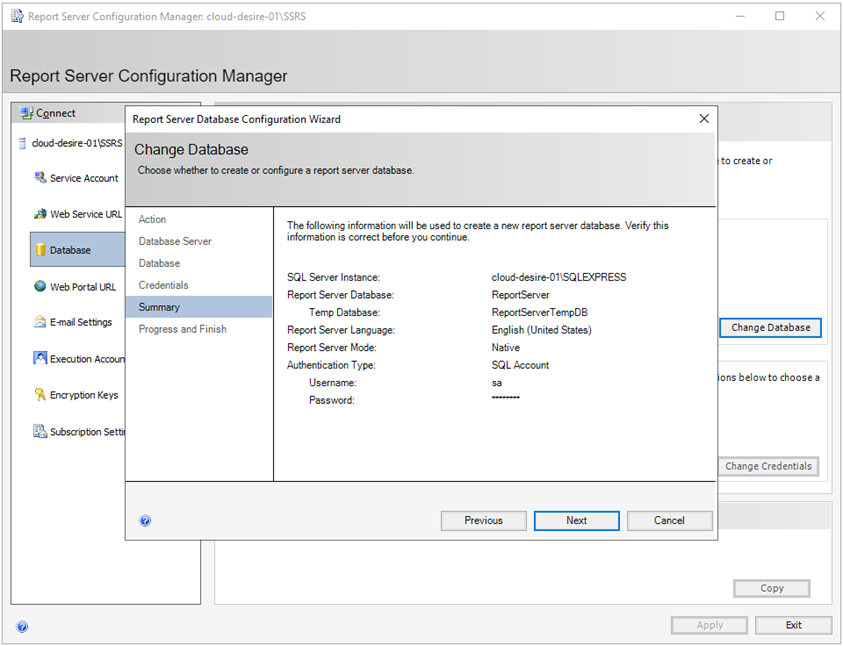
It will configure the report server database. After all the steps are executed successfully, click Finish .
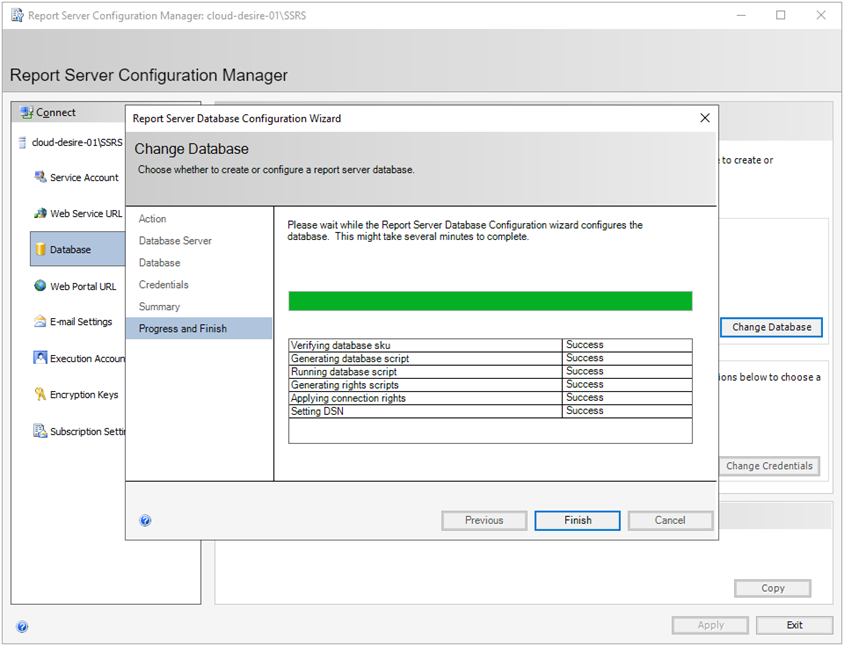
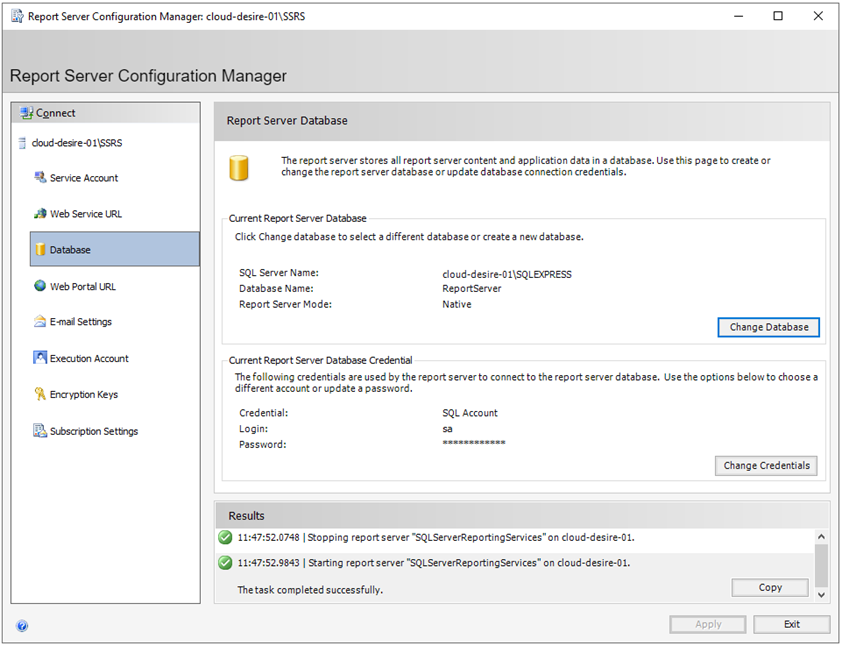
Click on the Apply button to finalize the Database configurations.
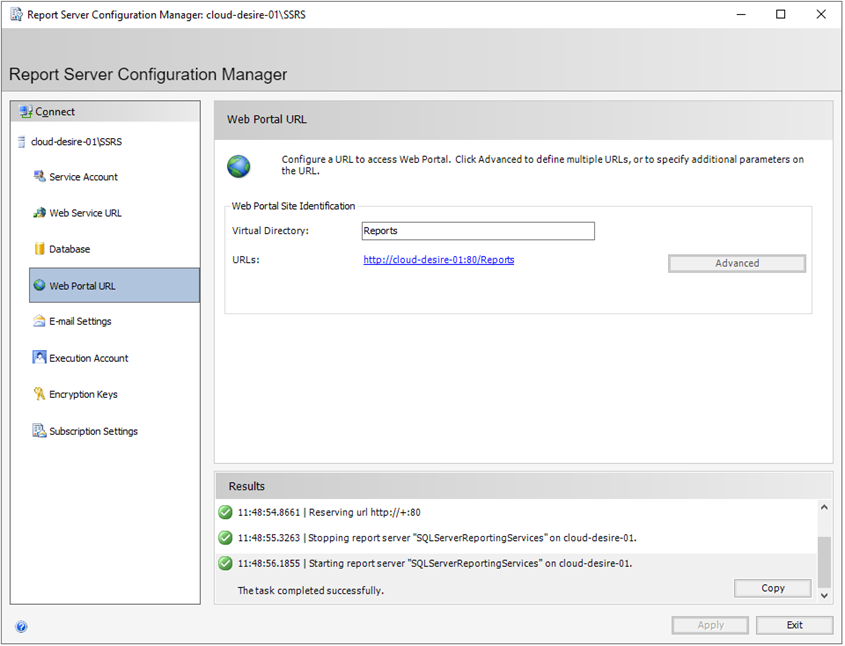
Next click on the Web Portal URL tab from the left panel. Here you can configure the web portal URL. We will use this URL to manage SSRS reports, data sources, report parameters, etc. It will preview URLs in the bottom section. I will go with default settings. Click on the Apply button and it will configure the report server web portal URL.
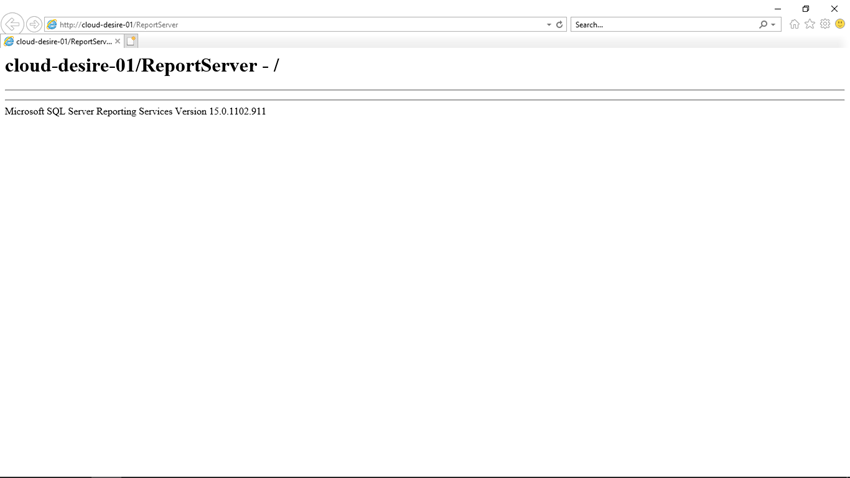
Now open the browser and enter the URL you configured in the Web Service URL section in step 4 (in my case http://cloud-desire-01/ReportServer). You should see the below web page which shows the report server name and SSRS version information.
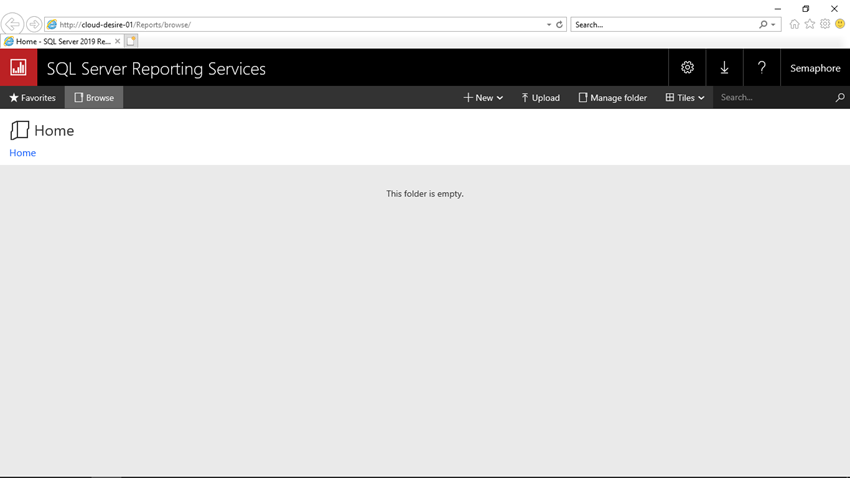
Now open another browser window and enter the URL you configured in the Web Portal URL section in step 13 (in my case http://cloud-desire-01/Reports). You should see below web page which shows the web portal for SSRS.
Excellent! We have successfully configured SQL Server Reporting Services. Now you can deploy reports and data sources using Visual Studio or Report Builder tool.
As you can see, it is very easy to configure SQL Server Reporting Services if you follow the above steps accurately.
- 30 th October, 2021: Initial version
This article, along with any associated source code and files, is licensed under The Code Project Open License (CPOL)

Introduction to SQL Server Reporting Services (SSRS)


Getting Started with SSRS
To start using SSRS, you need to have SQL Server installed with SSRS components. Once installed, you can access the Report Server, which is the central component in the SSRS architecture. It's responsible for storing, processing, and delivering reports to users. Reports can be delivered in various formats such as HTML, PDF, Excel, and more.
Report Building Tools
SSRS provides two main tools for creating reports:
- Report Designer : A feature-rich tool integrated into Microsoft Visual Studio that allows developers to create complex reports with precision layout.
- Report Builder : A more simplified tool intended for business users to create ad-hoc reports quickly.
Both tools offer a variety of data visualization options including tables, charts, maps, and gauges. You can also incorporate expressions and custom code for more advanced functionality.
Report Deployment and Management
Once you have created a report with either Report Designer or Report Builder, you can deploy it to the Report Server. This server is essentially a repository for published reports and associated resources. Deployed reports can be managed using SQL Server Management Studio or the web-based Report Manager.
Security Features
SSRS also includes robust security features to ensure that sensitive information remains protected. You can configure user access levels, authenticate users through Active Directory, and encrypt data to maintain confidentiality.
Example: Deploying a Basic Report
This snippet illustrates how simple it is to deploy a report that pulls product information from an inventory database.
The Value of Professional Expertise
While this introduction scratches the surface of what SSRS can do, harnessing the full capabilities of SSRS often requires professional expertise. Companies may opt to hire dotnet ms sql developers who specialize in crafting sophisticated reporting solutions tailored to specific business needs.
If you're interested in enhancing this article or becoming a contributing author, we'd love to hear from you.
Please contact Sasha at [email protected] to discuss the opportunity further or to inquire about adding a direct link to your resource. We welcome your collaboration and contributions!
Maximize Your Team's Potential with Remote Software Developers Skilled in Databases, Symfony, and Google Cloud
Hire Top-Tier Remote Developers Skilled in Databases, React, and AWS Elastic Beanstalk
Unlock the Power of Remote Software Developers with Expertise in Databases, Angular, and WebRTC

- Skip to content
- Skip to search
- Skip to footer
Products, Solutions, and Services
Want some help finding the Cisco products that fit your needs? You're in the right place. If you want troubleshooting help, documentation, other support, or downloads, visit our technical support area .
Contact Cisco
- Get a call from Sales
Call Sales:
- 1-800-553-6387
- US/CAN | 5am-5pm PT
- Product / Technical Support
- Training & Certification
Products by technology
- Software-defined networking
- Cisco Silicon One
- Cloud and network management
- Interfaces and modules
- Optical networking
- See all Networking

Wireless and Mobility
- Access points
- Outdoor and industrial access points
- Controllers
- See all Wireless and Mobility
- Secure Firewall
- Secure Endpoint
- Secure Email
- Secure Access
- Multicloud Defense
- See all Security

Collaboration
- Collaboration endpoints
- Conferencing
- Cisco Contact Center
- Unified communications
- Experience Management
- See all Collaboration

Data Center
- Servers: Cisco Unified Computing System
- Cloud Networking
- Hyperconverged infrastructure
- Storage networking
- See all Data Center
- Nexus Dashboard Insights
- Network analytics
- Cisco Secure Network Analytics (Stealthwatch)

- Video endpoints
- Cisco Vision
- See all Video

Internet of Things (IoT)
- Industrial Networking
- Industrial Routers and Gateways
- Industrial Security
- Industrial Switching
- Industrial Wireless
- Industrial Connectivity Management
- Extended Enterprise
- Data Management
- See all industrial IoT
- Cisco+ (as-a-service)
- Cisco buying programs
- Cisco Nexus Dashboard
- Cisco Networking Software
- Cisco DNA Software for Wireless
- Cisco DNA Software for Switching
- Cisco DNA Software for SD-WAN and Routing
- Cisco Intersight for Compute and Cloud
- Cisco ONE for Data Center Compute and Cloud
- See all Software
- Product index
Products by business type

Service providers

Small business

Midsize business
Cisco can provide your organization with solutions for everything from networking and data center to collaboration and security. Find the options best suited to your business needs.
- By technology
- By industry
- See all solutions
CX Services
Cisco and our partners can help you transform with less risk and effort while making sure your technology delivers tangible business value.
- See all services
Design Zone: Cisco design guides by category
Data center
- See all Cisco design guides
End-of-sale and end-of-life
- End-of-sale and end-of-life products
- End-of-Life Policy
- Cisco Commerce Build & Price
- Cisco Software Central
- Cisco Feature Navigator
- See all product tools
- Cisco Mobile Apps
- Design Zone: Cisco design guides
- Cisco DevNet
- Marketplace Solutions Catalog
- Product approvals
- Product identification standard
- Product warranties
- Cisco Security Advisories
- Security Vulnerability Policy
- Visio stencils
- Local Resellers
- Technical Support

Microsoft Dynamics 365 Blog

Microsoft and LinkedIn release the 2024 Work Trend Index on the state of AI at work
For our fourth annual Work Trend Index, out today, we partnered with LinkedIn for the first time on a joint report so we could provide a comprehensive view of how AI is not only reshaping work, but the labor market more broadly.
2024 release wave 1 kicks off with hundreds of AI-powered capabilities for Microsoft Dynamics 365 and Microsoft Power Platform
Introducing microsoft copilot for finance: transform finance with next-generation ai in microsoft 365 , microsoft copilot for sales and copilot for service are now generally available .

- Business Decision Makers
- News and product updates
- Dynamics 365 Business Central
Work smarter with Microsoft Copilot in Dynamics 365 Business Central
In the quickly changing world of AI, Microsoft Dynamics 365 Business Central is leading the way with innovations that have equipped more than 30,000 small and medium-sized businesses to succeed. Powered by next-generation AI, Microsoft Copilot in Dynamics 365 Business Central introduces new ways to streamline workflows, boost productivity, and unlock creativity.

- Dynamics 365 Field Service
Enabling fast, flexible, cost-effective service with Microsoft Copilot in Dynamics 365 Field Service
Fast, efficient service, it’s what everybody wants. And today’s field service organizations are answering the call by adopting next-generation AI technologies that can help them be more flexible and responsive to customers while also driving revenue, reducing overtime, and ensuring more predictable arrival and completion times.

- Thought leadership
- Dynamics 365 Guides
Early adopters of Microsoft Copilot in Dynamics 365 Guides recognize the potential for productivity gains
The integration of Microsoft Copilot into Dynamic 365 Guides brings generative AI to this mixed reality solution. Copilot for Dynamics 365 Guides transforms frontline operations, putting AI in the flow of work, giving skilled and knowledge workers access to relevant information where and when they need it.

- Dynamics 365 Customer Insights
2024 release wave 1: Transforming experiences with Microsoft Copilot and Dynamics 365
In this extraordinary age of AI, we find ourselves on the brink of a profound revolution. Companies are looking for generative AI to solve longstanding problems around customer connection, loyalty, and seller productivity.

Microsoft unveils AI features for manufacturers at Hannover Messe 2024
At Hannover Messe, the world’s leading industrial trade fair, organizations across engineering, digital technologies, energy, and more will gather to demonstrate solutions for high-performance, sustainable industries. Microsoft is honored to attend this year’s event to showcase how Microsoft Dynamics 365 helps manufacturers.

Introducing new Microsoft Copilot capabilities to optimize Dynamics 365 Field Service operations
Delivering exceptional service is key for building customer preference and loyalty. Today, we’re introducing new capabilities for Microsoft Copilot in Dynamics 365 Field Service that help service managers and technicians efficiently find the information they need to resolve issues right the first time while keeping customers updated at every step of the process.

- Dynamics 365 Customer Service
AI-powered innovations enhance customer service with 2024 release wave 1
We’re excited to announce the general availability of new and enhanced experiences in Microsoft Dynamics 365 Customer Service as part of our 2024 release wave 1 cadence. This release focuses on extending Microsoft Copilot capabilities by infusing generative AI into customer, agent, and supervisor experiences.

- Dynamics 365 Sales
New Microsoft Dynamics 365 and Microsoft Copilot innovations for supply chain, sales, and service join the 2024 release wave 1
Sellers, service agents, and supply chain professionals share a common goal: delivering quality goods and services to customers on time, every time. Today, we’re announcing new experiences for Microsoft Dynamics 365 that help professionals across business functions to collaboratively solve challenges, streamline workflows, and focus on what matters most—key factors for transformative customer experiences.

Revolutionizing marketing workflows with Copilot in Dynamics 365 Customer Insights
In the ever-evolving landscape of generative AI, a copilot isn't just a companion that makes tasks that you’re already doing at work easier, but it's quickly becoming a transformative force reshaping the very core of how things are done.

- Analyst reports
Forrester TEI study shows 315% ROI when modernizing customer service with Microsoft Dynamics 365 Customer Service
We are pleased to share the results of a March 2024 Forrester Consulting Total Economic Impact (TEI) Study commissioned by Microsoft. Forrester calculates Dynamics 365 Customer Service delivered benefits of $14.70 million over three years to a composite organization.

Explore the next wave of AI innovation at the Microsoft Business Applications Launch Event
Join Microsoft product leaders and engineers on April 10, 2024 for an in-depth look at the latest AI features and capabilities in Dynamics 365 and Microsoft Power Platform.

Microsoft is a Leader in The Forrester Wave™: Customer Service Solutions, Q1 2024
Most organizations find it’s no longer good enough to just measure successful service engagements solely on whether a customer issue is resolved. Instead, they aim to deliver personalized, fast service experiences at every touchpoint through all engagement channels.
SQL Server Reporting Services (SSRS) Tutorial
By: ray barley, next >>, comments for this article.


- Sin resultados
Actualización importante para SQL Server Reporting Services SP1 de 2016
Vea los productos y sistemas operativos que este artículo se aplica a. Este artículo describe un paquete de actualización importante (número de versión: 13.0.4199.0) para el Service Pack 1 (SP1) de Microsoft SQL Server 2016 Reporting Services. Esta actualización contiene correcciones para dos problemas que se presentaron en 2016 SP1 de SQL Server:
Si Reporting Services está configurado para utilizar una conexión (https/SSL) segura, puede mostrarse una advertencia acerca del contenido de seguridad.
En ciertos escenarios, el botón de impresión deja de funcionar.
Cómo obtener este paquete de actualización
La siguiente actualización está disponible en Microsoft Download Center:

Descargue ahora el paquete de actualización para Microsoft SQL Server 2016 SP1 Reporting Services. Si no aparece la página de descarga, póngase en contacto con el servicio al cliente de Microsoft para obtener el paquete de actualización.
Revisiones incluidas en este paquete de actualización
Notas para esta actualización, soporte técnico para esta actualización.
Si se producen problemas adicionales o si se requiere cualquier otra solución, será necesario crear una solicitud de revisión independiente. Los costos habituales de soporte se aplicarán a las preguntas de soporte técnico adicionales y a los problemas que no guarden relación con este paquete de actualizaciones específico. Para una lista completa de los números de teléfono de servicio al cliente de Microsoft o para crear una solicitud de servicio independiente, visite el sitio Web de soporte de Microsoft .
Cómo desinstalar esta actualización
Para ello, siga estos pasos:
En el Panel de Control, seleccione Agregar o quitar programas . Nota: Si está ejecutando Windows 7 o una versión posterior, seleccione programas y características en el Panel de Control.
Busque la entrada que corresponde a este paquete de actualización.
Presione y mantenga la entrada (o secundario) y, a continuación, seleccione desinstalar .
Requisitos previosPara aplicar este paquete de actualización, debe ejecutar el Service Pack 1 de SQL Server de 2016.
Información de reinicio Tendrá que reiniciar el equipo después de aplicar este paquete de actualización.
Información del registro Para utilizar una de las revisiones de este paquete, no es necesario realizar ningún cambio en el registro.
Referencias
Cómo obtener el service pack más reciente para SQL Server 2016.
Se ejecuta la secuencia de comandos para determinar qué versión y la edición de SQL Server Database Engine
El modelo de servicio Incremental de SQL Server entregar revisiones para problemas detectados.
Esquema de nomenclatura para los paquetes de actualización de software de Microsoft SQL Server.
Descripción de la terminología estándar que se utiliza para describir las actualizaciones de software de Microsoft.
Se aplica aEste artículo se aplica a lo siguiente:
Microsoft SQL Server Developer de 2016
Microsoft SQL Server Enterprise de 2016
Núcleo de Microsoft SQL Server de la empresa de 2016
Microsoft SQL Server Express de 2016
Microsoft SQL Server Standard de 2016
Microsoft SQL Server 2016 Programa de adopción de tecnología (TAP) Cuando se utiliza con:
Service Pack 1 de Microsoft SQL Server 2016
¿Necesita más ayuda?
¿quiere más opciones.
Explore las ventajas de las suscripciones, examine los cursos de aprendizaje, aprenda a proteger su dispositivo y mucho más.

Ventajas de la suscripción a Microsoft 365

Aprendizaje de Microsoft 365

Seguridad de Microsoft

Centro de accesibilidad
Las comunidades le ayudan a formular y responder preguntas, enviar comentarios y leer a expertos con conocimientos extensos.

Pregunte en Microsoft Community

Microsoft Tech Community

Windows Insiders
Microsoft 365 Insiders
¿Le ha sido útil esta información?
¡gracias por sus comentarios.

- Thought leadership
Using Microsoft SQL Reporting Services with Microsoft CRM Online
- Content type
Microsoft CRM Online has a built in reporting wizard that allows you to create reports online without any other tools. These reports are persisted in the CRM Online application. This allows you to create reports without any detail knowledge of the report architecture. This is very convenient for users and requires very little training to create your own reports, eliminating the need to know query languages or report formatting. The report wizard reduces the complexity of building reports and makes report building available to end users regardless of their report building prowess. Reducing complexity often results in scaled down functionality. An example of this ability to insert images or complex computations inside the report itself. So, to start, let’s at look at our supported, out of the box options:
1. CRM Online Reporting Wizard 2. CRM Online Views 3. CRM Online Export to Excel 4. CRM Online Mail Merge
As you can see, there are a number of ways to do reporting out of the box with CRM Online. Each of these offers both pros and cons. It’s widely known that Microsoft Reporting Services offers an extensive and robust framework for managing reports, commonly known as SRS.
Some of the advantages of SRS is the built in Visual Studio Report Designer and the server application to host the reports for access via a web browser. There are a good number of reasons to want to use SRS to manage CRM reports. The heart of an SRS report is RDL. RDL stands for Report Definition Language. RDL is defined using XML. RDL allows user to build reports similar to how html allows users to build web pages. Get on with it already….
To start, let’s define the steps we need to take to use SRS to host a CRM Online Report.
1. Extract CRM Data and make accessible to SRS. 2. Create SRS Report based on the data. 3. Create a report in CRM Online that points to the SRS report.
*The solution assumes you have your own instance of SRS.
1. Extract CRM Data and make accessible to SRS.
For obvious reasons, I wanted to introduce the out of the box reporting of CRM Online as well as SRS. First Loaded Question – Can I use SRS with CRM Online ? Well, not out of the box. SRS needs a data source to connect to the data. CRM Online supports web service access to the data. Access directly to the db layer is not accessible. Let’s look at the SRS data sources available:

You can see here that there is no native support for CRM Online. So we have to transform CRM Online data into a format that can be supported by SRS. Here are the 3 popular options:
Create a copy of CRM Data into a local SQL Server The first option you might consider is to create a copy of the data from CRM Online to a local SQL Server. This to me is the least reasonable choice because it will require some pretty serious kung fu to move all the data plus build a new database in SQL to hold the data. Also, moving large amounts of data across an HTTP connection is not really sufficient.
Build an ODBC Connector The next option to consider is to build an ODBC connector that used CRM Web Services calls on one side and exposed an ODBC interface on the other. This is not a bad option but I wanted something that could build reports in the background also. Plus the last time I wrote an ODBC connector , well let’s just say I’ve changed keyboards a few times.
So we are left with our third choice, XML. ( Who would have thunk ‘d it ).
XML is the lingua franca of data exchange ( just say no to tables ). It’s entire purpose is in describing data exchange. Industry approved. Respected, liked and loved by all.
At this point, I should point out that when using the SRS XML data source you must specify a web url to be used to load the data. File protocols are not supported. However, you can store the file on a web server and access using HTTP.
Now, we need to determine how to get our data out of CRM Online and into to scantily clad XML.
Out of the box Back to the out of the box options for a moment. You could create advanced find views and export the data into an Excel file and use Excel to save as xml. A bit manual but should work fine.
Custom Web Service This option would require you to create a web service that accesses CRM Online for data and return it as XML. I like this option from an architecture but not crazy about since I can’t schedule a web service to run automatically to update reports. Plus requires a server to host my web service and there are more security considerations. One advantage is you might be able to reuse the web services in other applications needing CRM data.
Agent/Service This option is to create software that runs locally that will pull data out of CRM and store in a XML file. I like this option the best since the reports can be scheduled run off hours and automatically. In addition, I find it the simplest of all the development options if your building the data extract yourself.
Another option would be to look at 3rd party integration tools such as ScribeSoft.
I decided to use a custom application or also known as agent/service/application.
I’ve built a tool previously, FetchIt Part 1 and FetchIt Part 2, that allows a fetch xml query to execute against CRM Online and have the results written to a file. It’s a simple console application that can run anywhere. It’s a simple in design. The development effort is relatively low and there is lots of sample code for how to make a fetch call. A console application can be scheduled to run automatically using the Windows Scheduler. It can be run on any machine with internet access. It can be run multiple times on a single machine ( once for each query ). The only thing needed is to change the fetch query statement in a configuration file for each report.
Fetch XML Fetch XML is an important part of the solution since it can be used to make complex queries into CRM Online. The prevents the need to have all the data local to do complex queries using SQL server. Fetch XML is part of the CRM Online web services and software SDK.
Here’s an example of querying all opportunities records in CRM. <fetch mapping=’logical’><entity name=’opportunity’><all-attributes/></entity></fetch>
Here’s an example of querying all open opportunities records in CRM and joining data from the account record.
<fetch mapping= "logical" > <entity name= "opportunity" > <attribute name= "estimatedclosedate" /> <attribute name= "estimatedvalue" /> <attribute name= "name" /> <filter> <condition attribute= "salesstagecode" operator = "eq" value = "200001" /> </filter> <link-entity name= "account" from= "accountid" to= "accountid" > <attribute name= "name" /> </link-entity> <link-entity name= "systemuser" from= "systemuserid" to= "owninguser" > <attribute name= "fullname" /> <attribute name= "systemuserid" /> </link-entity> </entity> </fetch>
2. Create SRS Report based on the extracted CRM Data.
Creating SRS reports is well documented and describe elsewhere much better than I would attempt. A few resources I would recommend:
Programming Microsoft SQL Server 2005 Microsoft SQL Server 2005 Reporting Services Microsoft SQL Server Reporting Services
While I won’t build the report in depth in the blog, I will point out the process I used. One of the reason I wanted to create an SRS report was to do computations in the report. Notice in my sample report that I sum the estimated value of all the opportunities for each user and provide a total count. This is just to demonstrate some of the computations you could do in a SRS report.
The first step is to create a shared data source to be used by the report designer. Notice that xml file that I used FetchIt to create is stored on my localhost web server.

This can be any URL other than file protocols.

On the Data tab, be sure to set your Data Query for you report to be empty. <Query></Query>. See SRS documentation for more info. Basically, we want all the records in the XML file. You could use this query to query the xml data.
Next load your report into SQL Reporting Manager. Be sure to create a data source for the report in the SRS Manager.

Next, create a report link in the SRS Manager. Copy the link and use in CRM Online. I found this easiest to open the report in my browser and copy the address.
http://localhost/Reports/Pages/Report.aspx?ItemPath=%2fAcme+Reports%2fOpen+Pipeline+Review+Link
Step 2 complete.
3. Create a report in CRM Online that points to the SRS report.
A nice feature of the built in CRM Online Reporting is that I can create a report that points to a web page or a file. The file option works nice for Excel documents and Word docs. I can use the web page option to specific my SRS Report.

Step 3 complete.
Opening the report from CRM Online will open the report in SRS.

You can build SRS reports for CRM Online in 3 easy steps.
Fetch XML allows you to build complex queries to sort and present your CRM Online data. It’s part of the CRM SDK, easy to use and well documented.
Using Microsoft SQL Reporting Services to report on CRM Online data is possible with a little effort. SRS gives you the ability to create rich reports using charts, computations, and text/images. In addition, you could use SRS to schedule reports to be automatic and emailed. There are many advantages to using SRS.
Related posts

Unlocking efficiency: Dynamics 365 Field Service integration for seamless operations

Leveraging Copilot in Dynamics 365 Sales to prepare for sales meeting

Create a data maintenance strategy for Dynamics 365 finance and operations data (part two)

Create a data maintenance strategy for Dynamics 365 finance and operations data (part one)
This browser is no longer supported.
Upgrade to Microsoft Edge to take advantage of the latest features, security updates, and technical support.
Reporting Services tutorials (SSRS)
- 12 contributors
Explore the capabilities of SQL Server 2016 (13.x) Reporting Services or later (SSRS), SQL Server Data Tools (SSDT), and Report Builder with sample data in these tutorials.
Create a basic table report (SSRS Tutorial)
Follow the steps in this tutorial to learn how to create your first report. This tutorial shows you how to work with SQL Server Data Tools (SSDT) to create a data connection (data source). It also shows you how to define a query (dataset) and configure a data region to contain your data.
Create a data-driven subscription (SSRS Tutorial)
Reporting Services provides data-driven subscriptions so that you can customize the distribution of a report based on a dynamic list of subscribers that receives the report. Report server administrators typically create and maintain data-driven subscriptions. The ability to create data-driven subscriptions requires expertise in building queries, knowledge of data sources that contain subscriber data, and elevated permissions on a report server.
Create drillthrough (RDLC) report with parameters - ReportViewer
Follow the steps in this tutorial to learn how to create a drillthrough report with parameters and a filter using the ReportViewer control.
Report Builder tutorials
These tutorials introduce you to various visualizations that you can create in Report Builder, such as maps and sparklines. They also show you how to use parameters and expressions.
Related content
- AdventureWorks sample databases
- Reporting Services samples on the TechNet wiki
- TechNet Wiki: SQL Server 2012 samples
Was this page helpful?
Coming soon: Throughout 2024 we will be phasing out GitHub Issues as the feedback mechanism for content and replacing it with a new feedback system. For more information see: https://aka.ms/ContentUserFeedback .
Submit and view feedback for
Additional resources

COMMENTS
Select Install Reporting Services. Choose an edition to install and then select Next. For a free edition, choose either Evaluation or Developer from the drop-down. Otherwise, enter a product key. Find the product key for SQL Server Reporting Services. Read and agree to the license terms and conditions and then select Next.
Microsoft SQL Server 2019 Reporting Services. SQL Server Reporting Services is a server-based reporting platform that provides comprehensive reporting functionality. Important! Selecting a language below will dynamically change the complete page content to that language. Select language. Download. Expand all.
Click Learn more, which will take you to Find the product key for SQL Server Reporting Services. Install Paid Edition. Click the Enter the product key radio button and enter the key in the box. Click Next. Review Licensing Terms. Read and accept license terms by checking the 'I accept the license terms' checkbox.
Download the installer from the Microsoft Download Center here: Microsoft SQL Server 2019 Reporting Services. Run the SQLServerReportingServices.exe executable when the download is complete, and the first screen will open. Click on 'Install Reporting Services'.
Installation of SQL Server 2017 Reporting Services. Once we have downloaded SQLServerReportingServices.exe, begin the install process by clicking on the setup file. This launches the setup process as shown below. This setup shows the release version of SQL Server Reporting Services. For example, above you can see Microsoft SQL Server Reporting ...
Microsoft SQL Server 2022 Reporting Services. SQL Server Reporting Services is a server-based reporting platform that provides comprehensive reporting functionality. Important! Selecting a language below will dynamically change the complete page content to that language. Select language. Download. Expand all.
Install Reporting Services from the download site. On the Report Builder page of the Microsoft Download Center , select Download. After Reporting Services finishes downloading, select Run. This step launches the SQL Server Reporting Services Wizard. Accept the terms in the license agreement and select Next.
Install Reporting Services SharePoint mode from the SQL Server installation media. If the SharePoint 2013/2016 Management Shell is open when you complete one of the workarounds, close and reopen the management shell. For more information, see the following articles: Where to find the Reporting Services add-in for SharePoint Products
Unlock the power of data visualization by learning how to install Microsoft SQL Server Reporting Services (SSRS) with our detailed step-by-step guide. Whethe...
Microsoft SQL Server 2022 Reporting Services. SQL Server Reporting Services is a server-based reporting platform that provides comprehensive reporting functionality. Important! Selecting a language below will dynamically change the complete page content to that language. Select language. Download. Expand all.
Begin by searching for "Download SSRS" or you can also find a link to the download page from the SQL Server 2017 Installation Center shown in Figure 13. Figure 13: A link to the download page for SSRS. Save and run the downloaded file. To get the installation started, click Install Reporting Services shown in Figure 14.
For the production environment, Don't install SSRS on the database server, instead, you should create a new server for SSRS. Install SQL Server Reporting Services. Mount your SQL Server Media ISO/CD > Run SQL Server Installation file > From SQL Server Installation Center > Click on Installation.
SSRS configuration. If you were unable to let the installation process configure SSRS for you, or are installing SSRS after the initial engine installation, or maybe you decided to configure SSRS on your own for fun, you will need to launch the Reporting Services Configuration Manager.. As discussed, we need to associate SSRS with a SQL Server instance, where it can create the reporting ...
Select Named Instance and enter the instance name to install Reporting Services to another instance of SQL server, and click on N ext to continue. Click on N ext to continue. In the Server ...
Step 1. Let us first download installation media for SSRS. To download compatible installation media, first run SQL Server Setup as shown in this article. Go to the Install SQL Server 2019 Developer Edition section of the article and follow steps 1 and 2. You will see the below screen.
To run the SSRS Configuration Manager, you will go to the Programs menu and select SQL Server Reporting Services Configuration Manager. Initially, a connection to the SSRS service must be made. After connecting to the SSRS service, step 1 is instructing SSRS configuration manager which account to use for the SSRS service.
Let us install and configure SQL Server Reporting Services on the local machine. Step 1. Let us first download installation media for SSRS. To download compatible installation media first run SQL Server Setup as shown in this article. Go to the Install SQL Server 2019 Developer Edition section of the article and follow steps 1 and 2.
SQL Server Reporting Services offers an updated suite of products: Paginated reports brought up to date, so you can create modern-looking reports, with updated tools and new features for creating them. A modern web portal you can view in any modern browser. In the new portal, you can organize and display paginated Reporting Services reports and ...
SQL Server Reporting Services (SSRS) is a comprehensive server-based report generation software system that provides a wide range of ready-to-use tools and services to help you create, deploy, and manage reports for your organization. SSRS is a part of Microsoft SQL Server services since the release of SQL Server 2000.
Configure the SSRS web service to not require integrated security. This can be done by changing to be false in the web.config. Note: On SQL Server 2008 x64, this file defaults to the location C:\Program Files\Microsoft SQL Server\MSRS10.MSSQLSERVER\Reporting Services\ReportServer\web.config. Restart the web service once the change has been made.
Cisco+ (as-a-service) Cisco buying programs. Cisco Nexus Dashboard. Cisco Networking Software. Cisco DNA Software for Wireless. Cisco DNA Software for Switching. Cisco DNA Software for SD-WAN and Routing. Cisco Intersight for Compute and Cloud. Cisco ONE for Data Center Compute and Cloud.
In the quickly changing world of AI, Microsoft Dynamics 365 Business Central is leading the way with innovations that have equipped more than 30,000 small and medium-sized businesses to succeed. Powered by next-generation AI, Microsoft Copilot in Dynamics 365 Business Central introduces new ways to streamline workflows, boost productivity, and ...
Refreshed Portal. In addition to the above updates, the SSRS portal was improved to provide a more inclusive modern graphical interface making it easier to deliver meaningful reporting on your data from a web-based experience. In the portal, you can view reports, KPIs, and navigate through the elements in your report server instance.
SQL Server Reporting Services 2008 (SSRS) is a feature included in the SQL Server 2008 product. We use SSRS to design, develop, test, and deploy reports. SSRS was originally slated to be released with SQL Server 2005 but it wound up being released a little bit ahead of SQL Server 2005. SSRS leverages the Business Intelligence Development Studio ...
Los Angeles County, officially the County of Los Angeles (Spanish: Condado de Los Ángeles), and sometimes abbreviated as L.A. County, is the most populous county in the United States, with 9,861,224 residents estimated in 2022.Its population is greater than that of 40 individual U.S. states.Comprising 88 incorporated cities and many unincorporated areas within a total area of 4,083 square ...
Open the Services console applications and verify that the Report Server service is running. To view the status of the Report Server service, click Start, point to Control Panel, double-click Administrative Tools, and then double-click Services. When the list of services appears, scroll to Report Server (MSSQLSERVER). The status should be Started.
No puede imprimir informes de Reporting Services después de instalar el Service Pack 1 de SQL Server de 2016. Reporting Services. 8977727. 3208484. Advertencia "se muestra únicamente el contenido seguro" al abrir un portal web o informe de SQL Server Reporting Services SP1 de 2016. Reporting Services
About. overall 1year 9 months of experience in database administration. • Maintaining production MSSQL Database Servers. • Experience in Installation, Configuration, Maintenance and Administration of. SQL Server2016, SQL Server 2017, SQL Server 2019. • Experience in applying SQL server service pack for SQL Server.
RDL is defined using XML. RDL allows user to build reports similar to how html allows users to build web pages. Get on with it already…. To start, let's define the steps we need to take to use SRS to host a CRM Online Report. 1. Extract CRM Data and make accessible to SRS. 2. Create SRS Report based on the data. 3.
Explore the capabilities of SQL Server 2016 (13.x) Reporting Services or later (SSRS), SQL Server Data Tools (SSDT), and Report Builder with sample data in these tutorials. Create a basic table report (SSRS Tutorial) Follow the steps in this tutorial to learn how to create your first report. This tutorial shows you how to work with SQL Server ...