English Compositions

Write a Report on Heavy Rainfall in Your City [PDF Available]
This example report writing is on heavy rainfall in your city.

HEAVY RAINFALL CAUSES DISRUPTION IN MUMBAI
After it rained simultaneously for 48 hours, Mumbaikars are now facing trouble.
By: Suprity Acharyya
02 July, 2020 4.30 pm IST, Mumbai: Heavy rains and gusty winds for 2 days straight brought the normal life of the busy city to a halt. Not only Mumbai but also the adjoining districts were severely affected by the floods triggered by this heavy rainfall.
According to the Indian Meteorological Department’s Santa Cruz observatory, the city received approximately 200 mm of rain in the last 48 hours. This is said to be the heaviest shower received by the city this year.
Several suburbs and parts of the city have reported flooding, property damage, and waterlogging. The water level rose above 4 feet in some areas causing severe damage.
The central part of Mumbai was the worst affected. The electric poles in many residential areas fell down which led to a blackout and posed as a death threat to a number of citizens. All the means of public transport were cancelled resulting in monetary losses and heavy inconvenience.
North Konkan is very likely to receive heavy rainfall at isolated places for the next 24 hours. The intensity of the fall is expected to reduce later.
Official sources said that several cheques were received as donations and contributions from all over the country were added to the State Relief Fund. More and more people were triggered to pour in donations observing the drastic agricultural losses.
It will take about 2 weeks to go back to normal as heavy rainfall can be expected the following week and readers are requested to avoid stepping out unnecessarily. For any queries feel free to ping the state helpline number 1098.
DEADLIEST FLOOD IN THE HISTORY OF INDIA
After almost a month of heavy rainfall, Karnataka was struck by a deadly flood.
29 August, 2019 7.00 pm IST, Karnataka: During the first week of August, torrential rainfall in monsoon caused heavy floods that affected the southern Indian state of Karnataka severely.
The Indian Meteorological Department issued a red alert to several coastal and malnad regions of the state as a security measure. It also informs that approximately 150 mm of rainfall is recorded daily. The state noticed heavy flooding from the start of the month which worsened with time.
According to official sources, 61 casualties have been reported so far. 15 citizens have been reported missing. The animal death count has risen to 859. Around 1150 relief camps have been opened. 5500+ houses have reported collateral damage, which forced thousands of people to move to relief camps.
The total property damage till now is estimated to be of Rs. 35,160 crores ($4.95 billion USD). Several districts including Belagavi, Bagalkot, Chikkamagaluru, Kodagu, Haveri, etc. have been affected. A total of 22 districts have been affected out of which the worst damage has been caused to the Belagavi district.
The National Disaster Response Force (NDRF) is handling evacuations and rescues. So far, around 6.73 lakh people have been evacuated. This flood is considered to be one of the deadliest floods in the history of India.
Following the series of unfortunate events, Chief Minister BS Yediyurappa announced a compensation of Rs. 5 lakhs for the family members of those who died. Fishermen, Indian Air Force, Karnataka police along with the Karnataka State Disaster Management are actively taking part in the rescue operations.
Donations are pouring in the State Disaster Response Fund. The government is facing heavy losses and is requesting citizens from all over the country to donate. Log on to www.ksndmc.org to help Karnataka.
Let me Know Your Thoughts
There you have your example report on Heavy Rainfall in Your City.
I hope you enjoyed reading this example, and find this stuff helpful. Right?
Do you have any specific topics that you want me to cover?
Either way, do let me know by leaving a quick comment below.
Yes, we're getting more extreme rainfall, and it's due to climate change, study confirms
Federal scientists predict more frequent and severe rainfall in future.

Research warns of more extreme rainfall, flooding if climate change not addressed
Social sharing.
Warmer temperatures due to climate change lead to wetter air, and we've seen more extreme rainfall and flooding across North America. But is there really evidence that the two are related?
Yes, there is.
A new study from researchers at Environment and Climate Change Canada found that climate change has made:
- Rainfall more extreme.
- Storms with extreme rainfall more frequent.
"We're finding that in North America, we have seen an increase in the frequency and severity of heavy rainfall events. And this is largely due to global warming," said Megan Kirchmeier-Young, a research scientist at Environment and Climate Change Canada and lead author of the study published this week in Proceedings of the National Academy of Sciences .

Already, the resulting flooding has destroyed homes and belongings, leading to billions in damage. And the study projects it will get worse.
"And as we continue to see warming, we will continue to see increases in the frequency and severity of extreme rainfall," Kirchmeier-Young said. "And heavy rainfall is one of the major factors in flash flooding, particularly in urban areas."
The study looked at the largest downpour of each year at sites across the U.S. and Canada and found the amount of rain for that event increased between 1961 and 2010.
Warmer means more moisture
Then it compared the observations to climate models that take into account the 1 C increase in temperature due to human activity since pre-industrial times.
" Physics tells us that a warmer atmosphere can hold more moisture," Kirchmeier-Young said. "That should be reflected as an increase in extreme precipitation in most locations."
Sure enough, the observations and the models were consistent with one another.

The largest increases in extreme precipitation were in the eastern part of North America.
In general across North America, Kirchmeier-Young says storms that would happen:
Once a century without human-caused climate change now happen every 20 years. And if the world gets to 2 C of warming above pre-industrial temperatures, those storms would happen once every five years.
Once every 20 years without human-caused climate change now happen every five years. And they're expected to happen about every other year if the world gets to 2 C of warming above pre-industrial temperatures.
Already, these changes have had a costly impact in the lives of Canadians.
Adding to the evidence
Natalia Moudrak, director of climate resilience at the University of Waterloo Intact Centre on Climate Adaptation noted that catastrophic losses due to extreme weather events have risen sharply. In the early 1980s, they averaged less than $500 million a year.
But from 2009 onward, they exceeded a billion dollars every year except 2015.
The level of flooding is not the only factor affecting losses. Other factors such as property values, paving over natural areas that can absorb rainfall and other kinds of disasters can also contribute. But, Moudrak said, "flooding is by far the No. 1 driver. Water damages are rising in Canada, and it's the elephant in the room."

Rising flood insurance claims were just some of the evidence that already pointed to increased extreme rainfall in North America before the publication of the new study.
Other studies had already found human-caused climate change was linked to increasing extreme rainfall on a global or hemisphere scale.
But Francis Zwiers, director of the Climate Impacts Consortium at the University of Victoria, said the new study is the first to link more frequent extreme rainfall and climate change in North America.
- Investing in climate change adaptation will pay off big, report says
- 'Building back better' and other tips for adapting to climate change
He explained that it gets harder to make those links on a smaller scale. That's because rain is localized and highly variable. That means if you look at data from rain gauges across the world, you can probably only see statistically significant changes in the intensity of precipitation in about 10 per cent or them.
"That's much more than we expect by accident when we're in a world where extreme precipitation is not changing," he said. "But what it's telling you is that when you look at the local scale the chances of seeing this happening in your backyard from the direct evidence that you can measure in your backyard is still very small."

The fact that it now can be measured on the scale of North America is significant, he said.
"When you go to smaller scales, when you are able to answer the question... then it indicates that the evidence is becoming stronger and clearer."
Every 50 years
But he noted a more local scale is more relevant to people's lives, with many implications.
For example, engineering standards are designed to expect building repairs from extreme rainfall and flooding at certain intervals, such as every 50 years."
"If extreme precipitation is becoming more intense, then you're going to have to make those repairs more often … and so then the building becomes more expensive to maintain."
- Insurers warn federal government Canada can't wait a decade to update flood maps
- Homeowners can do easy, inexpensive things to reduce flooding impact, expert says
Moudrak says Canadian governments and businesses are already adapting, by updating things like stormwater management guidelines and zoning bylaws and investing in flood resilience retrofits.
"The study, I think, does a really good job on underscoring that this is important work. It has to happen and has to happen today."
Related Stories
- How climate change gave added urgency to a $1.25B project to prevent flooding in Toronto
- Weather related damage causing home insurance rates to spike
- Exceptional is new normal: Experts break down anti-science tropes on extreme weather
- Ontario unveils new flooding strategy, but funding a question mark
- Metro Vancouver prepares for possibility of $30B flooding in Fraser Valley
External Links
- Summary of the paper in Proceedings of the National Academy of Sciences

Russell Millner/Alamy
Defend Our Planet and Most Vulnerable Species
Your donation today will be triple-matched to power NRDC’s next great chapter in protecting our ecosystems and saving imperiled wildlife.
Flooding and Climate Change: Everything You Need to Know
More communities—both coastal and inland—are finding themselves underwater. Extreme weather, sea level rise, and other climate change impacts are increasingly to blame.

A large wave crashes into a seawall in Winthrop, Massachusetts, a day after a nor'easter in 2018.
AP Photo/Michael Dwyer
- Share this page block
Floods are already the most common and among the most deadly disasters in the United States. As global warming continues to exacerbate sea level rise and extreme weather, flood-prone areas around the country are expected to grow by nearly half in just this century. Here’s how climate change plays a role in flooding and how we can better keep our heads above water.
Flooding facts and causes
Climate change and flooding, consequences of flooding, flood preparation and prevention, what causes a flood.
A flood, put simply, is the accumulation of water over normally dry land. It’s typically caused by the overflow of coastal or inland waters (like rivers and streams) or by an unusual accumulation of water from heavy or prolonged rains, storm surges, or sudden snowmelt. Often, the ways in which we manage our waterways (via dams, levees, and reservoirs) and the alterations we make to land also play a role in flooding. Increased urbanization, for example, adds impermeable surfaces (think roads and parking lots), altering natural drainage systems. Areas can be especially prone to flooding when stormwater infrastructure isn’t maintained or homes are built in areas susceptible to flooding known as floodplains. More and more, flooding factors are also linked to climate change.
Major types of floods
River flooding This occurs when a river or stream overflows its natural banks and inundates normally dry land. Most common in early spring, river flooding can result from heavy rainfall, rapidly melting snow, or ice jams. According to the 2018 study "Estimates of Present and Future Flood Risk in the Conterminous United States," published in the journal Environmental Research Letters , more than 40 million U.S. residents are at risk from flooding along rivers and streams. And even a single episode can wreak havoc on a massive scale: For instance, in 2019, a slow-motion disaster of intense spring flooding swelled the Arkansas, Mississippi, and Missouri rivers. Hundreds of miles of levees were topped or impaired, destroying homes and supersaturating cropland. According to the National Oceanic and Atmospheric Administration (NOAA), the inland flooding caused $20 billion in damage. Some of these losses stemmed from the impact to farmers who could no longer plant or transport their crops.
Coastal flooding More than half of the U.S. population lives or works in areas susceptible to coastal flooding, which happens when winds from a coastal storm, such as a hurricane or nor’easter, push a storm surge (essentially, a wall of water) from the ocean onto land. A storm surge can produce widespread devastation, like that seen around New York and New Jersey when Hurricane Sandy arrived during high tide .
There are also increasing numbers of shallow, nondeadly floods caused by higher sea levels. These high tide floods (also known as “nuisance” or “sunny day” floods) occur when the sea washes up and over roads and into storm drains as the daily tides roll in. In places like Miami, increased nuisance flooding is raising concerns over climate gentrification , as wealthier residents looking to settle on higher ground are pricing out historically underserved BIPOC communities.
Flash floods These quick-rising floods are most often caused by heavy rains over a short period—usually six hours or less. Flash floods can happen anywhere, and low-lying areas with poor drainage are particularly vulnerable. Also caused by dam or levee breaks or the sudden overflow of water due to a debris or ice jam, flash floods combine the innate hazards of a flood with speed and unpredictability. That’s why they’re responsible for the greatest number of flood-related fatalities. In late 2022 and early 2023, California was hit by deadly flash floods during powerful wintertime atmospheric rivers, which may become more powerful as climate change increases the amount of moisture they can hold.
Urban flooding The term urban flooding refers specifically to flooding that occurs when rainfall—not an overflowing body of water—overwhelms the stormwater drainage capacity of a densely populated area. In 2021, Hurricane Ida, strengthened by warm air, shattered records across the Northeast. In New York City, the deluge made rivers of impermeable streets and subway stations. Eleven people living in basement-level apartments drowned as the floodwaters—with nowhere else to go—swiftly overwhelmed below-ground spaces.

A tractor trailer is swept off the road by floodwaters in Nebraska in 2019.
Ryan Soderlin/Omaha World-Herald via AP
The Intergovernmental Panel on Climate Change (IPCC) has found that climate change “has detectably influenced” several of the variables that contribute to floods, such as rainfall and snowmelt. In other words, while our warming world may not be the only or most direct cause of any given flood, it exacerbates many of the factors that increase flood risk. That’s why mitigating climate change—and particularly, limiting global average temperature rise to within 1.5 degrees Celsius in this century—is an important way to avert some of the worst scenarios for sea level rise and escalating flood risks.
How does climate change lead to flooding?
These are some of the key ways that climate change increases flood risks.
Heavier precipitation A warmer atmosphere holds—and subsequently dumps—more water. As the planet has warmed by 1.9 degrees Fahrenheit since the preindustrial revolution era, the United States has also become about 4 percent wetter, according to the federal Climate Science Special Report. The same report says that heavy precipitation events are projected to increase by 50 percent to as much as three times the historical average in just this century. This includes extreme weather like atmospheric rivers, which are air currents that become heavy with water from the tropics. Meanwhile, in regions with significant seasonal snowmelt, hotter temperatures can trigger more rain-on-snow events, with warm rains inducing faster and earlier melting— a phenomenon playing out in the western United States.

A building and road severely damaged by flooding in Jamestown, Colorado, in 2013
Steve Zumwalt/FEMA
More-frequent hurricanes Climate change is increasing the frequency of our strongest storms, which bring greater rains, including in places not known for flooding. In August 2023, Tropical Storm Hilary—the first storm of its kind to hit the West Coast in 84 years—broke rainfall records in Idaho, Montana, Nevada, and Oregon. Hurricane Harvey, which made landfall as a Category 4 storm in 2017 and soaked Houston homes and businesses with catastrophic floods, was the nation’s wettest storm in nearly 70 years. Researchers estimate that Hurricane Harvey dumped as much as 38 percent more rain than it would have without climate change. Just a month after Harvey, Hurricane Maria hit Dominica, Puerto Rico, and the U.S. Virgin Islands. The storm produced the most rainfall in the area of any weather event since 1956 and exposed the inadequacy of U.S. policies to respond to disasters.
According to the IPCC, future hurricanes are expected to be as much as 37 percent wetter near their centers and about 20 percent wetter as much as 60 miles away. In the Atlantic basin, an 80 percent increase in the frequency of Category 4 and 5 hurricanes (the most destructive) is expected over the next 80 years. And it’s not only the most severely rated storms that bring the greatest flood impacts; in fact, the rating system the government uses to categorize the severity of storms is based solely on wind speed, not rainfall—so even unrated storms can unleash lethal amounts of water.
That said, gustier winds can whip up greater storm surges, which are already higher because of sea level rise. It was Hurricane Katrina’s 28-foot storm surge that overwhelmed the levees around New Orleans in 2005. Winds can also increase the destructiveness of waves, causing storm surges to get bigger and penetrate further inland.
Higher seas As ocean temperatures rise and the glaciers and ice sheets melt, global sea levels are rising —and directly contributing to coastal flooding problems. According to the Fourth National Climate Assessment, our oceans are approximately seven to eight inches higher than they were in 1900. The IPCC predicts seas around the world will rise anywhere from just under one foot to more than three and a half feet above 2000 levels by century’s end. NOAA’s projections also show that, due to regional factors such as currents bringing water to coastlines, areas along the East Coast could experience seas rising 2 feet higher as early as 2050. By then, damaging coastal flooding is expected to occur 10 times as often as it does today.
In addition to amplifying storm surges, sea level rise increases high tide flooding, which, according to NOAA, has doubled in the United States over the past 30 years. For example, by 2045, Charleston, South Carolina, could see as many as 180 tidal floods per year , compared with just 11 in 2014.

More than 100 houses burned down in Breezy Point, New York, as floodwaters isolated the community from fire and rescue workers after Hurricane Sandy.
U.S. Navy photo by Chief Mass Communication Specialist Ryan J. Courtade/Released
When flooding inundates a home or community, it upends lives. It’s important to consider flood preparation before disaster hits by doing things like signing up for alerts, packing an emergency supply kit, and researching flood insurance options.
But the impacts of flooding go far beyond our own homes. Repairing and replacing flood-damaged roads, bridges, utilities, and other public infrastructure carry enormous costs. Between 2007 and 2017, the National Flood Insurance Program (NFIP) paid an average of $2.9 billion per year to cover flood-related losses, with individual years often costing far more. Within two months of Hurricane Ian making landfall in Florida in 2022, the NFIP had received 44,000 flood claims from property owners. These types of estimates leave out the many people who don’t have insurance, who aren’t eligible for government disaster assistance, or who have needs above what government aid will cover.
Flooding also brings contamination and disease. Floodwaters can carry raw sewage , leaked toxic chemicals, and runoff from hazardous waste sites and factory farms. They can pollute drinking water supplies and cause eye, ear, skin, and gastrointestinal infections. When floodwaters recede, bacteria and mold may remain , and residents may suffer from mental health problems and lost business or wages.
As with many natural hazards, it is most often lower-income people, people experiencing homelessness, the elderly, and communities of color who suffer the greatest harm. These populations are least likely to have flood insurance , access to transportation during an evacuation, cash on hand, or the ability to relocate—and the structural inequities of the past and present mean they are more likely to be in harm’s way. In August 2022, flash flooding in Jackson, Mississippi, caused the city’s main water treatment plant to fail, leaving the 150,000 residents of the majority-Black city without safe water to drink, bathe in, or cook with. In the case of Jackson and many U.S. cities with similarly outdated infrastructure , flood damage was exacerbated by existing issues, including poor oversight, lack of local resources and capacity, and other unjust racial and economic disparities.
Entirely preventing floods isn’t possible. But there are steps that can be taken to lessen their devastation, like flood-proofing your home , taking personal safety precautions , and advocating the federal government to revamp its approaches to flooding, both before and after it occurs.

A neighborhood in Port Arthur, Texas, flooded by Hurricane Harvey in 2017
Staff Sgt. Daniel J. Martinez/U.S. Air National Guard
Updating FEMA's flood maps
Mitigating potential loss from future floods requires knowing where floods are most likely to occur. In the United States, this information is provided by FEMA, which produces maps of the nation’s flood zones. Its NFIP relies on these maps to assess flood risk, determine insurance rates, and establish floodplain management standards.
FEMA flood maps depict the high-, moderate-, and low-risk flood zones of communities nationwide and can be found at FEMA’s Flood Map Service Center . High-risk areas, often referred to as floodplains, are regions with a 1 percent (1 in 100) chance of being inundated by river or stream floodwaters of a certain magnitude in any given year. (The term 100-year flood refers to this, and does not mean a flood that’s expected to occur just once every 100 years.) But even a 1 in 100 chance of flooding each year equates to about a one in five chance that a home will flood at some point over the life of a 30-year mortgage. And FEMA’s moderate- to low-risk areas aren’t entirely safe from flooding, either: Properties in these areas still account for more than 20 percent of NFIP claims.
Flood risks change as land use and other factors change. That’s why keeping flood maps up-to-date is critical. But despite a requirement that FEMA reassess its maps every five years, nearly 60 percent are out of date—some, by decades. When Hurricane Sandy hit in 2012, for example, the flooding covered an area that was 65 percent larger than the flood-vulnerable area identified by FEMA maps.
FEMA’s maps also typically fail to take into account the effects of global warming, such as sea level rise . Instead, they rely on historical data to determine future flood hazard projections. This can cause officials to designate areas as being “safe” for development today, even when they are at risk of serious floods tomorrow. In 2021, NRDC and the Association of State Floodplain Managers jointly petitioned FEMA to update its standards to reflect the new climate reality. After all, FEMA is required under law to use the best available science in its maps and standards. Among the petition’s requests: all new or substantially improved structures must be elevated higher than the level of a 100-year flood; all new and revised NFIP floodplain maps must depict how the floodplain will change over time, especially concerning sea level rise; homeowners seeking to retrofit their homes for the new climate reality should have easier access to NFIP funding.
Among other things, FEMA’s floodplains determine how and where homes and other structures will be built, as well as who is required to purchase flood insurance. (Coverage is mandatory if you live in a floodplain and have a federally backed mortgage.) The problem is, once again, that many of FEMA’s mapped floodplains are inaccurate . For instance, during Hurricane Harvey, nearly three-quarters of Houston’s flood-damaged buildings sat outside of FEMA’s identified high-risk area. According to one NOAA analysis: Greater rainfall has made what used to be a 100-year flood event in Houston, by FEMA’s standards, more like a 25-year event.
Understanding your home's flood risk
Flooding is a factor in hundreds of billions of dollars of disaster-related property damage in the United States, with many homes being repeatedly damaged . Just one inch of flooding could cost the average homeowner $25,000 in damage . But typical homeowners’ and renters’ insurance fails to cover flooding and less than 4 percent of homeowners have flood coverage. That means the vast majority of Americans must take out loans or pay out of pocket to repair or replace damaged items.
Finding out if a property is flood-prone can also be difficult . Many states have no legal requirements that a seller disclose a property’s history of flood damage to a buyer or that a landlord tell a prospective renter. While potential homebuyers should look at FEMA’s flood history maps, there’s a more low-tech option: Introduce yourself to your prospective neighbors and ask them about flooding in the area.

This Highlands, New Jersey, home was elevated prior to Hurricane Sandy and received only minor damage.
Rosanna Arias/FEMA
For residents of repeatedly flooded homes, relocation may be the best option. But a wide array of measures exist to prevent or reduce flood damage when that’s not possible. These include keeping gutters and drains free of debris; installing a sump pump for crawl spaces and basements; adding check valves in sewer lines to keep floodwater from backing up into the drains of your home; and safeguarding equipment by elevating furnaces, water heaters, electrical systems, generators, and air-conditioning units above flood levels. More drastic retrofits might be needed in areas with regular flooding, including raising the entire structure of a house.
Boosting local resilience
Flood resiliency can come from water-smart improvements to buildings and green infrastructure , restored wetlands and other natural barriers, updated FEMA maps that reflect new climate realities, and an overhaul of the NFIP to help more homeowners relocate to higher ground. One promising update is President Biden’s executive action to reinstate the Federal Flood Risk Management Standard , which includes commonsense measures such as requiring FEMA to rebuild flood-damaged public infrastructure like police stations, schools, and hospitals to be safer. (President Trump had scrapped the standard in 2017.)
According to a Pew poll, nearly 75 percent of U.S. voters support these measures. For one thing, they can save enormous amounts of money: For every $1 invested in riverine flood mitigation, taxpayers and the federal government save $7 in recovery costs. Moreover, such measures increase the odds that millions more people will stay safe—and dry.
In addition to securing your home, you can help secure your community. Checking in on your neighbors, sharing information, and determining how you might be able to help each other in an emergency are important components of disaster preparedness.
This story was originally published on April 19, 2019, and has been updated with new information and links.
This NRDC.org story is available for online republication by news media outlets or nonprofits under these conditions: The writer(s) must be credited with a byline; you must note prominently that the story was originally published by NRDC.org and link to the original; the story cannot be edited (beyond simple things such as grammar); you can’t resell the story in any form or grant republishing rights to other outlets; you can’t republish our material wholesale or automatically—you need to select stories individually; you can’t republish the photos or graphics on our site without specific permission; you should drop us a note to let us know when you’ve used one of our stories.
Related Stories

Mapping Urban Heat Islands Is Helping These Neighborhoods Adapt

What Are the Solutions to Climate Change?

What Is Climate Gentrification?
When you sign up, you’ll become a member of NRDC’s Activist Network. We will keep you informed with the latest alerts and progress reports.

Global evidence links rise in extreme precipitation to human-driven climate change

Ph.D. candidate in Atmospheric and Oceanic Sciences, University of California, Los Angeles

Professor and Director, UCLA Center for Climate Science, University of California, Los Angeles

Assistant Researcher, UCLA Center for Climate Science, University of California, Los Angeles

Project Scientist, Atmospheric and Oceanic Sciences, University of California, Los Angeles
Disclosure statement
Gavin D. Madakumbura receives funding from the US Department of Energy.
Alex Hall receives research funding from the National Science Foundation and the US Department of Energy.
Chad Thackeray receives funding from the National Science Foundation and the US Department of Energy.
Jesse Norris receives funding from the US Department of Energy.
University of California, Los Angeles provides funding as a member of The Conversation US.
View all partners
The Research Brief is a short take about interesting academic work.
The big idea
Human activities, such as burning fossil fuels for transportation and electricity, have worsened the intensity of extreme rainfall and snowfall over land in recent decades, not just in a few areas but on a global scale, new research shows.
Past studies were able to attribute individual extreme events and long-term changes in some regions to climate change, but global assessments have been more difficult. We used a new technique to analyze precipitation records from around the world and found conclusive evidence of human influence on extreme precipitation in every region.
Scientists have been warning that rising global temperatures will lead to more extreme precipitation in the future, mainly because warm air “holds” more water vapor in the atmosphere, fueling storms.
With Earth already about 1 degree Celsius (1.8 F) warmer since the start of the industrial era, we wanted to find out if that change had already started.
Past attempts to detect the human influence in historical precipitation records typically required long time series with many consecutive years of data . But precipitation is difficult to monitor over long periods from land or space, so those records are rare. We found another way.
We used artificial neural networks, a type of machine learning, to find patterns of extreme precipitation in weather records. Once those neural networks understood what to look for, we could analyze shorter and more disparate observational records.
The result is multiple lines of evidence that human activity has intensified extreme precipitation during recent decades. Even when the data sets were widely different , we were able to see the human influence.
The findings were published July 6, 2021, in the journal Nature Communications.
Why it matters
Understanding how humans influence extreme precipitation is important for interpreting climate events today and for preparing cities and protective infrastructure for the changing world ahead.
In recent years, devastating flooding has made headlines after extraordinary rainfall that historically would have been extremely rare. The 2017 hurricane season in Texas, Florida and Puerto Rico and the extreme monsoon rains over India and Bangladesh in 2017 are two examples. Our results indicate that, as a general rule, precipitation has become more extreme around the world in recent decades.
Perhaps more importantly, our results indicate that further warming of the planet through the 21st century is likely to continue to intensify the most extreme precipitation events. Climate models project such an intensification will happen this century, and they suggest that a similar but less-rapid intensification occurred in the 20th Century , based on how much the planet has already warmed. Our results validate that finding.
With greenhouse gas levels in the atmosphere still increasing, the planet is projected to continue warming through the 21st century . How much it warms will depend on choices made today about fossil fuel use and other major contributors to climate change. That 1 degree of warming could be 4 degrees by the end of the century if emissions continue at a high rate.
What’s next
While we clearly identified the influence of humans on extreme precipitation in the past, we haven’t yet isolated how much each type of human activity has contributed. Greenhouse gas emissions, aerosols and changes in land use can all have an influence. We plan to modify our machine learning method in the future to home in on those sources.
The machine learning method we used is also currently learning from data alone. We can take this up a notch by bringing climate physics into the algorithm . By doing that, the machine would learn the physical processes that lead to intensifying extreme precipitation. Other climate variables could be included, such as winds, clouds and radiation, helping to answer not just whether extreme precipitation is intensifying, but why.
- Climate change
- Extreme weather
- Precipitation
- Climate models
- Extreme rainfall
- Attribution study
- Attribution science
Head, School of Psychology
Lecturer In Arabic Studies - Teaching Specialist
Senior Research Fellow - Women's Health Services
Lecturer / Senior Lecturer - Marketing
Assistant Editor - 1 year cadetship
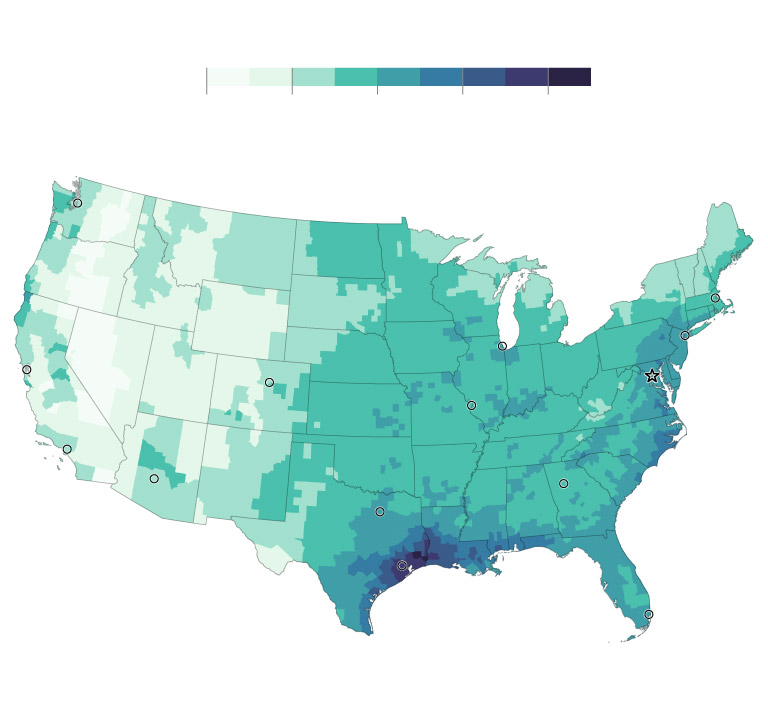
The places in the U.S. most at risk for extreme rainfall
New data from the nonprofit First Street Foundation finds that climate change is fueling more devastating rains and flooding in parts of the country

Intensity of extreme rainfall
8 in. per hour
Precipitation expected to occur once in 100 years
San Francisco
Los Angeles
Data not available for Alaska or Hawaii
Source: First Street Foundation
Precipitation rate expected to occur once in 100 years

Intensity of
extreme rainfall
Minneapolis
Philadelphia
New Orleans

Kim Schultz still struggles to describe how hard and fast the rain fell in her corner of southern Indiana that afternoon last September.
“I’ve never seen anything like it. Never,” she recalled.
Relentless rainfall inundated parts of the area — including 4.59 inches in a single hour at one spot in nearby Switzerland County, according to the National Weather Service. The deluge transformed the creek that runs near her home near Madison, Ind., into a raging river that swept away a calf and hundreds of hay bales, she said.
The floodwaters tore the asphalt off the top of a nearby bridge, carried away numerous vehicles, ripped trees from their roots, left roads impassable. One house was carried from its foundation and destroyed, killing a 61-year-old woman who lived there.
“You just don’t realize the power of water until you see it for yourself,” Schultz said.
The torrential rains that struck this corner of southern Indiana were rare. But in this area and others across the country, such devastating precipitation is becoming more common as the world grows warmer, according to new data released Monday by the nonprofit First Street Foundation.
In a new peer-reviewed model , the group says the U.S. government’s current precipitation frequency estimates, considered the authoritative source for planning and infrastructure design nationwide, do not fully capture the frequency and severity of extreme precipitation in a changing climate. What now qualifies as a “1-in-100 year storm” — in short, an event with a 1 percent chance of happening any given year — is already happening more often in some places.
In the county where Schultz lives, First Street’s figures show such storms could happen five times as often. Fifty miles southwest in Louisville, heavy downpours could come about nine times as often, according to the group’s model.

Where official risk assessments may underestimate intensity of extreme storms
Underestimated
Overestimated
Percent difference in hourly depth between NOAA and First Street estimates of 1-in-100 year rainfall

Where official risk assessments may
underestimate intensity of extreme storms

Percent difference in hourly depth between NOAA and First Street estimates of 1 in 100 year rainfall
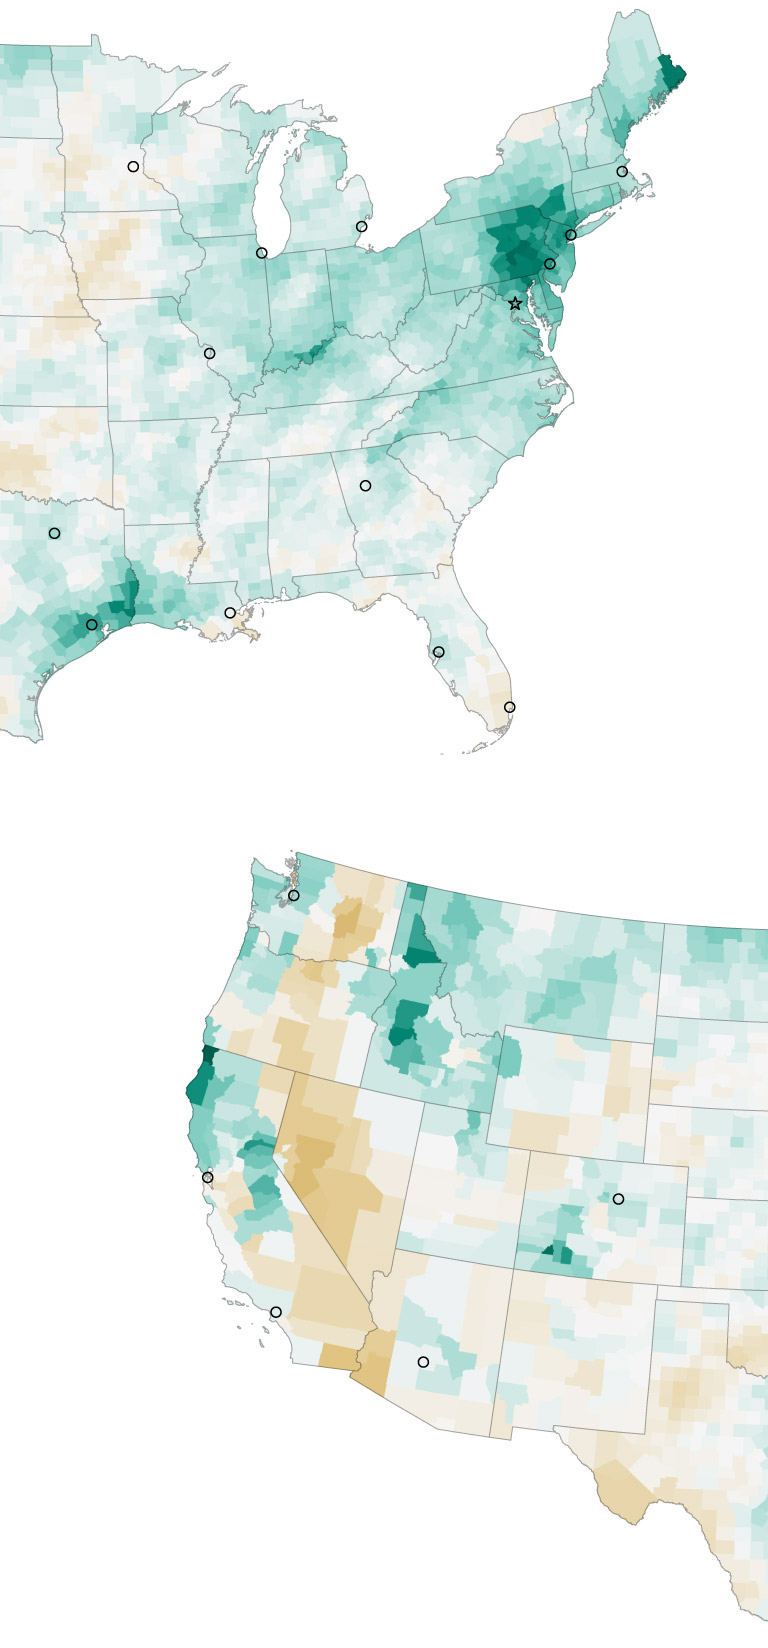
Because the government’s official precipitation estimates don’t yet account for climate change, “it is underpredicting what the actual risk is today,” said Matthew Eby, First Street’s founder and chief executive.
By First Street’s estimates, more than half of Americans now live in an area that is twice as likely to experience such a rain event than is predicted by Atlas 14 , produced by the National Oceanic and Atmospheric Administration and considered the gold standard of precipitation frequency estimates across the United States.
Roughly 20 percent of the country can now expect a 1-in-100-year storm to happen every 25 years, First Street finds. And in the case of about 20 counties that are home to more than 1.3 million people — including parts of Indiana, Kentucky, Pennsylvania, North Carolina and elsewhere — such extreme rain events could happen on average once a decade, if not more often, the group said.
“The magnitude of the changes in expected rainfall intensity are startling for many areas in the United States,” Jungho Kim, First Street’s senior hydrologist and a lead author on the new study, said in announcing the findings. “And it is important that Americans are fully aware of this consequence of climate change that can impact their lives and homes.”
The warming atmosphere is supercharging various weather-related disasters — wildfires, hurricanes, crippling heat waves . But it also is fueling once-unthinkable amounts of rain in single bursts. The resulting deluges pose serious challenges in a nation where aging roads, antiquated storm-water systems and other infrastructure are increasingly outmatched.
Over and over, scientists have documented a central explanation driving the shift toward more frequent devastating rains. For every degree Fahrenheit that the air temperature increases, the atmosphere can hold about 4 percent more water.
The world already has warmed at least 1.9 degrees Fahrenheit (1.1 Celsius) since preindustrial times. That increased heat means more moisture in the air — in the United States, much of it comes off the Gulf of Mexico — and more fuel for more intense rainstorms.
“There is a growing acceptance that as the globe warms, extreme precipitation will increase,” said Kenneth Kunkel, an atmospheric sciences professor at North Carolina State University who has studied precipitation trends for decades.
As that happens, having accurate data about changing precipitation patterns is critical for communities nationwide.
In recent years, most notably in the 2021 Bipartisan Infrastructure Law and in last year’s Inflation Reduction Act , Congress set aside hundreds of billions of dollars to fund historic upgrades to the nation’s drinking water systems, bridges, rail systems, interstates, ports and other key infrastructure.
But Eby and others worry that there is a risk that large sums of money could be wasted on projects that are not actually designed to stand the test of time, given that the climate of the future will look very different from the past.
Chad Berginnis, executive director of the Association of State Floodplain Managers, said that for a long time, the government’s approach toward precipitation estimates assumed that the probabilities of extreme events remained relatively constant in a given place.
“For decades, that probably worked fairly well,” Berginnis said of relying on historical data alone. But, he added, “over the last couple decades, that has changed pretty significantly.”
In Harris County, Tex., home to Houston, First Street estimates that 60 percent more rain could now fall during a 1-in-100-year storm compared with what Atlas 14 shows for the area. The same goes for the areas around Baltimore and Philadelphia.
As climate change fuels more extreme rain events, particularly in places such as the Northeast, the Ohio River Valley and along parts of the Gulf Coast, the old assumptions are no longer sufficient. While some jurisdictions might be able to pay to undertake more elaborate studies of potential risks in a hotter future, many local officials and planners must rely primarily on NOAA’s existing precipitation frequency estimates when deciding how to build a new project.
“Every year we are spending millions and billions of dollars on infrastructure, and we are doing it only looking to the past for guidance, and not looking into the future,” Kunkel said.
NOAA is keenly aware of the issue, but until recently did not have the resources to construct forward-looking, nationwide estimates of precipitation that also account for the impacts of climate change. Last year, however, Congress gave the agency new funding to create a more robust, comprehensive set of data for every corner of the country — and to update its estimate no less frequently than once every 10 years.
The agency is working steadily toward that goal. But it has said the work will take years and probably won’t be complete until 2027.
In a statement, NOAA declined to comment on First Street’s research. But the agency said the “scientific rigor” behind its precipitation frequency estimates is why they are the standard relied on by engineers and city and regional planners across the country.
The agency’s methodology “undergoes a rigorous peer review process and employs broad stakeholder engagement” to ensure accuracy, transparency and trust, it said.
NOAA is working to develop Atlas 15, which will incorporate historical changes in rainfall intensity as well as estimates based on models of future climate conditions. The agency said it also “is concurrently undertaking experimental research and testing of methodologies to use its extensive climate modeling capabilities to provide accurate estimates of future precipitation on a global scale.”
As engineers, public works officials and planners wait for updated, authoritative federal projections, First Street is hoping to help fill the gap by offering what it calls “an early understanding” of what NOAA’s estimates are likely to produce.
“The First Street data might have the greatest value in the immediate planning environment,” said David Conrad, senior water resource policy adviser to the flood plain managers group. “People can look at that and say, ‘Are we on track? And should we make any adjustments?’”
The answers matter. In the case of a city expanding a storm-water system, underestimating how often heavy downpours might occur could mean pipes won’t drain fast enough to prevent flooding on streets or in homes. A new road could flood more often than expected, shortening its useful life.
First Street, which has previously examined how climate change is deepening risks posed by floods, wildfires , heat and hurricane wind strength, created its latest analysis using data from nearly 800 federal weather stations. Researchers focused on the past 20 years of rain gauge data, in an effort to highlight how the warming atmosphere has increasingly played a role in more intense rain events.
As with the group’s previous analysis, the latest findings underscore how significant amounts of risk are likely unaccounted for in parts of the country.
Americans should consider the rising number of catastrophic rain events in recent decades not as outliers, but rather “as the ‘new normal’ for many areas,” Monday’s report finds. “What this means for communities today is that their understanding of risk is often underestimated,” the group wrote, “and in many locations the infrastructure in place or that is currently being built to protect communities, property and individuals is built to an insufficient standard.”
For his part, Eby said he hopes the findings will help officials think carefully about how they spend taxpayer dollars on major projects, and to have the foresight to grasp how the atmosphere in many places is changing.
“This data hopefully will open people’s eyes,” he said. “[To] realize what the true risk is today, and also what it will be in the future.”

Extreme Weather Toolkit: Heavy Rain and Flooding

Climate change is bringing heavier rainfall extremes and increased, inequitable flood risk to many parts of the U.S.
For every 1°F of warming the air can hold an extra 4% of moisture, increasing the chances of heavier downpours that contribute to the risk of flash floods.
The rapid onset of flash floods limits time to get people out of harm’s way. In the U.S., racial minorities and those living in mobile homes are disproportionately exposed to flood risk, especially in the South and in rural areas.
In the U.S., extreme daily rainfall has become more frequent since the 1980s. Hourly rainfall intensity has also increased since 1970 — by 13% on average across 150 U.S. locations analyzed by Climate Central.
And from 1958 to 2021, the heaviest 1% of rainfall events became 60% and 45% wetter in the Northeast and Midwest, respectively — and 1% to 37% wetter for all other regions in the continental U.S.
Changes in rainfall from 1988 to 2017 accounted for one-third of U.S. flood damages (about $73 billion) over that same period. And the most intense downpours caused the largest damages .
The latest IPCC reports indicate that precipitation extremes are likely to increase globally, even in regions with decreasing average precipitation.
Most of the U.S. is projected to see increases in precipitation extremes with 2°C (3.6°F) of warming. With high future levels of heat-trapping emissions, U.S. flash floods could also intensify — especially in the Southwest. A recent study suggests that the burdens of an estimated 26% increase in overall U.S. flood risk by 2050 could disproportionately impact Black communities along the Atlantic and Gulf coasts.
Updated: April 2024
These resources explore the science, trends, and local impacts of heavy rain and flooding in the U.S.

Climate Matters
Extreme Precipitation in a Warming Climate
Climate change is supercharging the water cycle, bringing heavier precipitation extremes across the U.S.

Climate Change and Inland Flooding
Flooding is costly, damaging, and deadly. It affects much of the U.S. and is likely to intensify with warming and shifting rainfall patterns.
Rising Hourly Rainfall Intensity
Hourly rainfall intensity—a key factor in flash floods—has increased since 1970 in 136 U.S. locations analyzed by Climate Central.
Atmospheric Rivers
Atmospheric rivers bring both vital water resources and deadly hazards—especially in the western U.S.
Changing precipitation normals
We look at the change in precipitation between the 1991-2020 and 1981-2010 periods, and break down the regional and seasonal patterns across the U.S.
After the Storm: Damp, Moldy Homes
Extreme weather events fueled by climate change bring health risks—including from damp, moldy homes after storms and floods.
Wettest Seasons in U.S. Regions
Water supplies, agriculture, and ecosystems all rely on precipitation. Explore seasonal precipitation patterns in U.S. states and regions and see how they’re changing.
Thank you for visiting nature.com. You are using a browser version with limited support for CSS. To obtain the best experience, we recommend you use a more up to date browser (or turn off compatibility mode in Internet Explorer). In the meantime, to ensure continued support, we are displaying the site without styles and JavaScript.
- View all journals
- Explore content
- About the journal
- Publish with us
- Sign up for alerts
- NEWS AND VIEWS
- 12 January 2022
Extreme rainfall slows the global economy
- Xin-Zhong Liang 0
Xin-Zhong Liang is in the Department of Atmospheric and Oceanic Science and the Earth System Science Interdisciplinary Center, University of Maryland, College Park, Maryland 20742, USA.
You can also search for this author in PubMed Google Scholar
In July 2021, record-breaking rainfall brought severe floods to Europe, where 200,000 properties lost electrical power. In the same month, torrential rain with a maximum intensity of 201.9 millimetres in a single hour led to devastating floods (Fig. 1) in Henan province, China, forcing more than one million people to relocate. These flooding events each caused roughly US$12 billion in property damage. Such losses, incurred during or shortly after extreme events, represent a direct negative impact on the economy. But how does excessive precipitation affect macroeconomics indirectly in the longer term? Writing in Nature , Kotz et al. 1 report a comprehensive assessment of changes in gross regional product (GRP) relating to excessive precipitation, and conclude that increases in the numbers of wet days and in extreme daily rainfall dramatically reduce worldwide macroeconomic growth rates.
Access options
Access Nature and 54 other Nature Portfolio journals
Get Nature+, our best-value online-access subscription
24,99 € / 30 days
cancel any time
Subscribe to this journal
Receive 51 print issues and online access
185,98 € per year
only 3,65 € per issue
Rent or buy this article
Prices vary by article type
Prices may be subject to local taxes which are calculated during checkout
Nature 601 , 193-194 (2022)
doi: https://doi.org/10.1038/d41586-021-03783-x
Kotz, M., Levermann, A. & Wenz, L. Nature 601 , 223–227 (2022).
Article Google Scholar
Botzen, W. J. W., Deschenes, O. & Sanders, M. Rev. Environ. Econ. Policy 13 , 167–188 (2019).
Li, Y., Guan, K., Schnitkey, G. D., DeLucia, E. & Peng, B. Glob. Change Biol. 25 , 2325–2337 (2019).
Vogel, E. et al. Environ. Res. Lett. 14 , 054010 (2019).
Liang, X.-Z. et al. Proc. Natl Acad. Sci. USA 114 , E2285–E2292 (2017).
Article PubMed Google Scholar
Ortiz-Bobea, A., Ault, T. R., Carrillo, C. M., Chambers, R. G. & Lobell, D. B. Nature Clim. Change 11 , 306–312 (2021).
Boers, N. et al. Nature 566 , 373–377 (2019).
IPCC. Climate Change 2021: The Physical Science Basis. Contribution of Working Group I to the Sixth Assessment Report of the Intergovernmental Panel on Climate Change (eds Masson-Delmotte, V. et al. ) (Cambridge Univ. Press, in the press).
Sun, C. & Liang, X.-Z. Clim. Dyn. 55 , 1325–1352 (2020).
Download references
Reprints and permissions
Competing Interests
The author declares no competing interests.
Related Articles

See all News & Views
- Climate change
- Climate sciences

Monsoons are changing in India — here’s how to climate-proof the economy
World View 28 MAY 24

Risks of bridge collapses are real and set to rise — here’s why
Comment 28 MAY 24

Singapore Airlines turbulence: why climate change is making flights rougher
News Explainer 22 MAY 24
Inequality is bad — but that doesn’t mean the rich are
Correspondence 14 MAY 24

Daniel Kahneman obituary: psychologist who revolutionized the way we think about thinking
Obituary 03 MAY 24

Scientists urged to collect royalties from the ‘magic money tree’
Career Feature 25 APR 24
Assistant, Associate or Full Professor
The McLaughlin Research Institute and Touro University – Montana campus invite applications for open rank faculty positions.
McLaughlin Research Institute
Postdoctoral Associate- Neuroscience
Houston, Texas (US)
Baylor College of Medicine (BCM)
Call for applications- junior and senior scientists
The BORDEAUX INSTITUTE OF ONCOLOGY (BRIC U1312, https://www.bricbordeaux.com/) is seeking to recruit new junior and senior researchers
Bordeaux (Ville), Gironde (FR)
INSERM - U1312 BRIC
Postdoctoral Scholar - Organic Synthesis
Memphis, Tennessee
The University of Tennessee Health Science Center (UTHSC)
Postdoctoral Scholar - Chemical Biology
Sign up for the Nature Briefing newsletter — what matters in science, free to your inbox daily.
Quick links
- Explore articles by subject
- Guide to authors
- Editorial policies

An official website of the United States government
Here’s how you know
Official websites use .gov A .gov website belongs to an official government organization in the United States.
Secure .gov websites use HTTPS A lock ( Lock A locked padlock ) or https:// means you’ve safely connected to the .gov website. Share sensitive information only on official, secure websites.
JavaScript appears to be disabled on this computer. Please click here to see any active alerts .
Climate Change Indicators: Heavy Precipitation
This indicator tracks the frequency of heavy precipitation events in the United States.
This figure shows the percentage of the land area of the contiguous 48 states where a much greater than normal portion of total annual precipitation has come from extreme single-day precipitation events. The bars represent individual years, while the line is a nine-year weighted average.
Data source: NOAA, 2021 6 Web update: April 2021

This figure shows the percentage of the land area of the contiguous 48 states that experienced much greater than normal precipitation in any given year, which means it scored 2.0 or above on the annual Standardized Precipitation Index. The thicker line shows a nine-year weighted average that smooths out some of the year-to-year fluctuations.
Data source: NOAA, 2021 7 Web update: April 2021
Key Points | Background | About the Indicator | About the Data | Technical Documentation
- In recent years, a larger percentage of precipitation has come in the form of intense single-day events. Nine of the top 10 years for extreme one-day precipitation events have occurred since 1996 (see Figure 1).
- The prevalence of extreme single-day precipitation events remained fairly steady between 1910 and the 1980s, but has risen substantially since then. Over the entire period from 1910 to 2020, the portion of the country experiencing extreme single-day precipitation events increased at a rate of about half a percentage point per decade (see Figure 1).
- The percentage of land area experiencing much greater than normal yearly precipitation totals increased between 1895 and 2020. There has been much year-to-year variability, however. In some years there were no abnormally wet areas, while a few others had abnormally high precipitation totals over 10 percent or more of the contiguous 48 states’ land area (see Figure 2). For example, 1941 was extremely wet in the West, while 1982 was very wet nationwide. 3
- Figures 1 and 2 are both consistent with other studies that have found an increase in heavy precipitation over timeframes ranging from single days to seasons to years. 4 For more information on trends in overall precipitation levels, see the U.S. and Global Precipitation indicator.
"Heavy precipitation" refers to instances during which the amount of rain or snow experienced in a location substantially exceeds what is normal. What constitutes a period of heavy precipitation varies according to location and season.
Climate change can affect the intensity and frequency of precipitation. Warmer oceans increase the amount of water that evaporates into the air. When more moisture-laden air moves over land or converges into a storm system, it can produce more intense precipitation—for example, heavier rain and snow storms. 1 The potential impacts of heavy precipitation include crop damage, soil erosion, and an increase in flood risk due to heavy rains (see the River Flooding indicator)—which in turn can lead to injuries, drownings, and other flooding-related effects on health. 2 In addition, runoff from precipitation can impair water quality as pollutants deposited on land wash into water bodies.
Heavy precipitation does not necessarily mean the total amount of precipitation at a location has increased—just that precipitation is occurring in more intense events. However, changes in the intensity of precipitation, when combined with changes in the interval between precipitation events, can also lead to changes in overall precipitation totals.
About the Indicator
Heavy precipitation events can be measured by tracking their frequency, examining their return period (the chance that the event will be equaled or exceeded in a given year), or directly measuring the amount of precipitation in a certain period (for example, inches of rain falling in a 24-hour period).
One way to track heavy precipitation is by calculating what percentage of a particular location’s total precipitation in a given year has come in the form of extreme one-day events—or, in other words, what percentage of precipitation is arriving in short, intense bursts. Figure 1 of this indicator looks at the prevalence of extreme single-day precipitation events over time.
For added insight, this indicator also tracks the occurrence of unusually high total yearly precipitation. It does so by looking at the Standardized Precipitation Index (SPI), which compares actual yearly precipitation totals with the range of precipitation totals that one would typically expect at a specific location, based on historical data. If a location experiences less precipitation than normal during a particular period, it will receive a negative SPI score, while a period with more precipitation than normal will receive a positive score. The more precipitation (compared with normal), the higher the SPI score. The SPI is a useful way to look at precipitation totals because it allows comparison of different locations and different seasons on a standard scale. Figure 2 shows what percentage of the total area of the contiguous 48 states had an annual SPI score of 2.0 or above (well above normal) in any given year.
About the Data
Indicator notes.
Weather monitoring stations tend to be closer together in the eastern and central states than in the western states. In areas with fewer monitoring stations, heavy precipitation indicators are less likely to reflect local conditions accurately.
Data Sources
The data used for this indicator come from a large national network of weather stations and were provided by the National Oceanic and Atmospheric Administration’s (NOAA’s) National Centers for Environmental Information. Figure 1 is based on Step #4 of NOAA’s U.S. Climate Extremes Index; for data and a description of the index, see: www.ncdc.noaa.gov/extremes/cei . Figure 2 is based on the U.S. SPI, which is shown in a variety of maps available online at: www.ncdc.noaa.gov/sotc/drought . The data used to construct these maps are available at: ftp://ftp.ncdc.noaa.gov/pub/data/cirs/climdiv .
Technical Documentation
- Download related technical information PDF
1 USGCRP (U.S. Global Change Research Program). 2017. Climate science special report: Fourth National Climate Assessment, volume I. Wuebbles, D.J., D.W. Fahey, K.A. Hibbard, D.J. Dokken, B.C. Stewart, and T.K. Maycock, eds. https://science2017.globalchange.gov . doi:10.7930/J0J964J6.
2 Bell, J.E., S.C. Herring, L. Jantarasami, C. Adrianopoli, K. Benedict, K. Conlon, V. Escobar, J. Hess, J. Luvall, C.P. Garcia-Pando, D. Quattrochi, J. Runkle, and C.J. Schreck, III. 2016. Chapter 4: Impacts of extreme events on human health. The impacts of climate change on human health in the United States: A scientific assessment. U.S. Global Change Research Program. https://health2016.globalchange.gov .
3 NOAA (National Oceanic and Atmospheric Administration). 2012. National Climatic Data Center. Personal communication: Analysis by Derek Arndt, April 2012.
4 USGCRP (U.S. Global Change Research Program). 2017. Climate science special report: Fourth National Climate Assessment, volume I. Wuebbles, D.J., D.W. Fahey, K.A. Hibbard, D.J. Dokken, B.C. Stewart, and T.K. Maycock, eds. https://science2017.globalchange.gov . doi:10.7930/J0J964J6.
5 NOAA (National Oceanic and Atmospheric Administration). 2021. U.S. Climate Extremes Index. Accessed January 2021. www.ncdc.noaa.gov/extremes/cei .
6 NOAA (National Oceanic and Atmospheric Administration). 2016. U.S. Climate Extremes Index. Accessed January 2016. www.ncdc.noaa.gov/extremes/cei .
7 NOAA (National Oceanic and Atmospheric Administration). 2021. Standardized Precipitation Index data files. Accessed January 2021. ftp://ftp.ncdc.noaa.gov/pub/data/cirs/climdiv .
Learn about other indicators in this section

- Indicators Home
- Greenhouse Gases
- U.S. and Global Temperature
- Seasonal Temperature
- High and Low Temperatures
- U.S. and Global Precipitation
- Heavy Precipitation
- Tropical Cyclone Activity
- River Flooding
- A Closer Look: Temperature and Drought in the Southwest
- Snow and Ice
- Health and Society
- Dig into the Data
- Indicator Stories
- About the Indicators
- Report Writing On Flood
Report Writing on Flood
One of the most common topics that are included in the English language is report writing. Report writing is generally introduced in the syllabus of students who are in higher classes. Students can be asked to write reports about various topics, and one of such topics is floods.
Floods are quite common in low-lying areas and areas that are near water bodies. Floods mostly happen when rivers overflow due to heavy or incessant rain. Areas that get submerged in water don’t have adequate dams built to hold the flowing water. Almost every year, many areas and farming lands go under water. Hundreds of people get affected and either lose their livelihoods or homes during this situation.
So when you are writing a report about floods, you need to mention factors including the reasons that have led to the floods, the areas that have been flooded, the damage that has been caused by the floods, the measures taken to help with the damage, and the people affected.
The following flood reports will help you write the same even if you are writing them for the first time. So without wasting much time, go through the reports given below.
Report of Flood in West Bengal
The entire district of Bakura, West Bengal, faced heavy rainfall for hours this week. More than five villages were flooded and over five lakh people were affected. The flood was mainly caused due to the increased level of water in the Damodar. The areas drained by the river were affected badly as most of the land went under water. The agricultural lands and livestock were badly affected too. Though the authorities had moved around three lakh people to different flood shelters, many were still stuck. The NDRF and army personnel were deployed to handle the situation and ensure no lives were lost during the flood. The government had opened many helpline numbers to assist the people in distress. Various authorities were instructed to help people with clean water, proper food and medicines. Health inspectors were deployed to check the medical condition of the people in the shelter. The government had announced that people who were severely affected by the flood would be given monetary assistance. The Chief Minister had formed a committee that would look into the areas where people were severely affected and provide them with the necessary assistance they needed. The Irrigation and Waterways Minister was instructed by the Chief Minister to look into the situation and come up with a plan to prevent loss of life and property during floods in the future.
Report of Flood in Assam
On 15th July 2021, due to heavy rainfall, the Brahmaputra river flooded and, as a result, affected many areas. Almost 10 lakh people were affected due to the flooding of the Brahmaputra, and several houses in the village and agricultural lands went under water. The government released a statement saying 50 people in the low-lying areas had drowned due to the severe flooding around it. The government said that, in spite of their flood control efforts, more than ten villages were under water. They informed the press that this mainly happened due to continuous heavy rainfall for the past four days. The Chief Minister instructed the Irrigation and Waterways Minister to look into the situation and prepare a report on it. Many houses, even in the cities, were affected, and houses along the river had either gone underwater or had been severely damaged. The army and NDRF team had worked quite hard to get the people to a safe shelter. To ensure that people don’t get affected by waterborne diseases, the Chief Minister had asked a team of doctors to visit the shelter homes and provide the people with proper medical assistance. Various local authorities and NGOs worked together to provide clean drinking water, food and clothes to the affected people. The government announced monetary and medical assistance for the affected.
Frequently Asked Questions (FAQs)
Define report writing..
Detailed accounts or write ups on any topic based on given information and evidence is known as report writing.
How to write a report on a flood?
To write a report on a flood, one has to add details like why the flooding took place, how many people were affected and what steps were taken to help people affected in the flood.
Register with BYJU'S & Download Free PDFs
Register with byju's & watch live videos.
Supported by

Texas Storms Topple Power Lines and Trees
Sparks flew behind one Dallas home as a powerful storm system brought high winds, heavy rain and large hail.
By Storyful and Reuters
Storm Kills at Least 1 in Texas, Where Power Could Be Out for Days
More than half-a-million customers were without power after hail the size of golf balls and dangerous winds hit Texas. More severe weather was likely later on Tuesday.
By Remy Tumin and Jenny Gross

Cyclone Remal Uproots Trees, Rips Down Power Lines in Bangladesh
People braved high winds and heavy rain to clear debris as the storm tore through the region.
By The New York Times

Severe Storms and Tornadoes Cause Destruction in Several States
Severe weather hit several parts of the United States over the weekend, killing more than 20 people and leaving hundreds of thousands without power.
By The Associated Press and Storyful

Una tormenta deja un rastro de destrucción en Houston
Al menos cuatro personas perdieron la vida cuando un fuerte temporal arrasó la región. Las autoridades evaluaban los daños el viernes.
Storm Carves Path of Destruction Across Houston
At least four people were killed when powerful weather ripped through the region. Officials were taking stock of the damage on Friday.

Deadly Storm Hits Texas
Heavy rains and winds shattered windows, scattering glass and debris on the streets of Houston.
By Storyful

Storms Batter Houston, Leaving at Least 7 Dead
School officials canceled classes in the city on Friday, and hundreds of thousands were left without power. It may take as much as 48 hours to restore power to some customers.
By Orlando Mayorquín, Jesus Jiménez and Victoria Kim

East Texas, Already Soaked, Prepares for a ‘Nightmare Scenario’ of More Rain
Some places in Texas have seen a year’s worth of rainfall since January.
By Judson Jones

‘Cold Lava’ and Flash Floods Kill 37 in Indonesia
Heavy rain on the island of Sumatra caused torrents of rock and ash to flow down a volcano and into nearby towns. At least 17 people were still missing.
By Yan Zhuang and Muktita Suhartono
Advertisement
- Election 2024
- Entertainment
- Newsletters
- Photography
- Personal Finance
- AP Investigations
- AP Buyline Personal Finance
- AP Buyline Shopping
- Press Releases
- Israel-Hamas War
- Russia-Ukraine War
- Global elections
- Asia Pacific
- Latin America
- Middle East
- Election Results
- Delegate Tracker
- AP & Elections
- Auto Racing
- 2024 Paris Olympic Games
- Movie reviews
- Book reviews
- Personal finance
- Financial Markets
- Business Highlights
- Financial wellness
- Artificial Intelligence
- Social Media
What’s causing the catastrophic rainfall in Kenya?
FILE - Children flee floodwaters that wreaked havoc at Mororo, border of Tana River and Garissa counties, Kenya, April 28, 2024. (AP Photo/Andrew Kasuku, File)
FILE - Residents rescue a woman who was caught during heavy rain in the Mathare area of Nairobi, Kenya, April 24, 2024. (AP Photo/Andrew Kasuku, File)
FILE - A displaced woman sits on a couch outside her flooded house, after heavy rain in the Mathare area of Nairobi, Kenya, April 24, 2024. (AP Photo/Brian Inganga, File)
FILE - Floodwaters are visible in Ombaka Village, Kisumu, Kenya, April 17, 2024. (AP Photo/Brian Ongoro, File)
FILE - Kenyan Red Cross personnel and volunteers conduct search and rescue missions, around houses submerged by flood water in Machakos county, Kenya, April 22, 2024. (AP Photo/Brian Inganga, File)
FILE - A woman is rescued from her flooded house by Red Cross workers in Githurai area of Nairobi, Kenya, April 24, 2024. (AP Photo/Edaward Odero, File)
FILE - Residents gather around the covered dead body of a woman found in a house after heavy rain in the Mathare area of Nairobi, Kenya, April 24, 2024. (AP Photo/Brian Inganga)
FILE - A family uses a boat after fleeing floodwaters that wreaked havoc in the Githurai area of Nairobi, Kenya, April 24, 2024. (AP Photo/Patrick Ngugi, File)
- Copy Link copied

NAIROBI, Kenya (AP) — The torrential rains and deadly floods that have hit Kenya since March have been some of the most catastrophic in the country in recent years.
At least 169 people have died due to the heavy rains, with at least 91 missing, according to the latest government figures.
In the most tragic single event, at least 48 people were killed on Monday after water blew through a blocked river tunnel under a railway line in southwestern Kenya, causing a flash flood. The rain has displaced more than 190,000 people and damaged roads and other infrastructure.
The devastating rains are a result of a mix of factors, including the country’s seasonal weather patterns, human-caused climate change as well as natural weather phenomena.
Here’s how they combined to create the deadly deluge.
Residents rescue a woman who was caught during heavy rain in the Mathare area of Nairobi, Kenya, April 24, 2024. (AP Photo/Andrew Kasuku)
WHAT IS KENYA’S ‘LONG RAINS’ SEASON?
Kenya and some other parts of eastern Africa have two main rainfall periods : the “long rains” season of March to May, and the “short rains” season of October to December.
The “long rains” season is when most of the country’s average annual rainfall occurs. It’s often characterized by torrential rains, and sometimes goes up to June.
In its forecast for this year’s “long rains” season, the Kenya Meteorological Department predicted above-average rainfall in many parts of the country, with occasional storms in some. It also warned of flash floods, landslides, mudslides and other impacts.
Last year’s “short rains” season was characterized by severe storms in many parts of the country, particularly in November. Lamu, Mombasa and Garissa counties received nearly three times their long-term average rainfall, according to the meteorological department .
A displaced woman sits on a couch outside her flooded house, after heavy rain in the Mathare area of Nairobi, Kenya, April 24, 2024. (AP Photo/Brian Inganga)
WHY IS THE RAIN SO INTENSE THIS TIME?
The frequency, patterns and intensity of rainfall in Kenya are influenced by naturally occurring climate systems like the Indian Ocean Dipole.
The Indian Ocean Dipole is a swinging of sea surface temperatures that makes the western Indian Ocean warmer than average then colder than average than those of the eastern Indian Ocean. It has positive, neutral and negative phases.
The positive phase causes heavy rainfall in areas west of the Indian Ocean, such as Kenya, and droughts in Indonesia and Australia.
While many people have linked the current floods to the naturally occurring El Nino weather phenomenon, research shows that the climate event has little influence on rainfall over East Africa during the “long rains” season, said Joyce Kimutai, research associate at Imperial College London.
El Nino is the warming of the ocean over the Pacific Ocean, which changes the routes for storms and it can cause heavy rainfall in some parts of the world and droughts in others.
But in Kenya’s case, it’s highly likely that the positive Indian Ocean Dipole and climate change explain the ongoing flood-inducing rainfall, she said.
Warmer oceans caused by the hotter atmosphere increase evaporation, and air holding more moisture can produce more intense rainfall.
In an analysis in December last year, Kimutai and colleagues from World Weather Attribution, a group of scientists that analyze whether climate change played a role in extreme weather, found that human-caused climate change had made last year’s “short rains” season in Kenya and other parts of eastern Africa up to two times more intense.
Floodwaters are visible in Ombaka Village, Kisumu, Kenya, April 17, 2024. (AP Photo/Brian Ongoro)
WHEN WILL THE ‘LONG RAINS’ END?
It’s become difficult to predict long-term weather in Kenya in recent years, as the onset and duration of dry and wet seasons increasingly change.
The Kenya Meteorological Department expects the “long rains” season to continue into June.
In its latest seven-day weather forecast , which it released on Monday, the department said it expects rainfall to continue in several parts of the country, with heavy downpour likely to occur in six regions, as well as flooding in low-lying areas and landslides in steep slopes.
The Associated Press’ climate and environmental coverage receives financial support from multiple private foundations. AP is solely responsible for all content. Find AP’s standards for working with philanthropies, a list of supporters and funded coverage areas at AP.org .

Connecting Rainfall and Landslides
On February 17, 2006, the Philippine village of Guinsaugon disappeared. A massive landslide swallowed more than 350 houses and an elementary school, burying more than 1,100 people. Residents of the village, situated at the foot of a mountain on Leyte Island, had no warning and no time to evacuate. While there was no direct trigger for the Guinsaugon landslide, experts and officials explored several causes, including several days of unusually heavy rainfall that had saturated the mountainside prior to the slide.
While rainfall-induced landslides can happen within minutes, the wet conditions that precede them can take several hours or days to develop. But many countries in high-risk areas lack the resources to maintain the extensive weather networks required to successfully observe these conditions. Robert Adler, a senior scientist in the NASA Laboratory for Atmospheres at Goddard Space Flight Center, and Yang Hong, a research scientist at NASA's Goddard Earth Sciences and Technology Center (GEST), approached the problem from space. A reliable satellite-based system would help minimize the challenge of maintaining local systems, especially in regions where heavy rains and flooding often wash away ground-based instruments. Adler and Hong are merging data from an array of satellites to determine whether remote sensing instruments can indicate where rainfall-induced landslides might occur. Adler said, “If we can complete this research and make the results available on the Web, then almost any government or organization in the world can access this information.”

Mapping landslide susceptibility
Rainfall is the key factor in Adler and Hong’s study, but first the scientists needed to determine which areas were most prone to landslides. The first step was to piece together a global landslide susceptibility map, which would help reveal terrain and ground properties. Hong said, “Rainfall can be a trigger for landslides, but ground conditions are also very important.” The researchers needed to account for a range of factors, including terrain, soil type, and land-cover characteristics. However, there was no single source for the data they required. “In order to look at landslide susceptibility, we needed multiple data sources,” Hong said.
To compile the map, Adler and Hong used digital elevation models to establish terrain and slope, as well as flow path and direction for rivers and water runoff. Satellite data helped the researchers determine land-cover types, including forests, grasslands, wetlands, deserts, and urban areas. Adler and Hong relied on a soil properties map to distinguish global soil composition and depth.
The map revealed no surprises—the researchers already had a general idea which regions of the world were susceptible to landslides. But the map did provide a solid basis against which to compare rainfall data, and illuminated areas that exhibited the key ingredients for a landslide. “The most important factors are the slope and soil type. Steep slopes and coarse soil types are more susceptible to landslides,” Hong said. “And, in terms of land cover, bare soil contributes more to landslides.”
Landslides occur everywhere in the world, but the danger of rainfall-induced slides tends to be much greater in tropical mountainous regions like those in the Philippines, Central and South America, and southeastern Asia. Steep terrain, combined with the heavy rains brought by monsoon seasons, hurricanes, and typhoons puts dense populations at risk.

Remotely sensing rainfall
To analyze global rainfall, Adler and Hong required multiple data sources from a variety of satellites. Their primary source of rain data, however, was the NASA Tropical Rainfall Measuring Mission (TRMM), obtained from NASA's Goddard Earth Sciences Data and Information Services Center (GES DISC).
Adler said, “There are two main things that TRMM provides for this multi-satellite analysis. One, it’s the calibrator for the information from the other satellites. Two, it’s always in the tropics, and gives us very good coverage in a critical area.” Launched in 1997, the TRMM satellite was specifically designed to observe tropical rainfall and storm characteristics. TRMM orbits the Earth from west to east along the equator, weaving between 35 degrees north and 35 degrees south. Several of the other satellites from which Adler and Hong collect data are in polar orbits that travel north to south, passing near or over the north and south poles during each orbit and crossing the equator during each pass. “Because the TRMM orbit crosses over the paths of each polar-orbiting satellite, we’re able to collect subsets of data from both satellites at the same time,” Adler said. “We use TRMM data, which we think is making the best estimate, to calibrate, or adjust the rain estimates from the other satellites.” Calibrating the satellites helped correct errors and eliminate inconsistencies, allowing scientists to obtain the most precise rainfall measurements.
To verify the correlation they observed, Adler and Hong identified seventy-four rainfall-induced landslides that occurred between the TRMM launch and 2006, including the Guinsaugon slide. They plugged archived rainfall data into an equation that incorporated rainfall intensity and duration to determine a “threshold” for each of the landslides. Adler and Hong’s satellite-deduced results closely matched previous rainfall-gauge-based threshold estimates, confirming that extremely intense rainfall overwhelmed the thresholds for each of the sites and triggered the slides, particularly when the heaviest rain fell in a short duration of less than twelve hours. Their findings demonstrated that a satellite-based approach could successfully indicate potential landslide conditions.
Landslides from ground and space
After the February 17, 2006, landslide that destroyed Guinsaugon, officials scrambled to pinpoint a cause. Landslides can be caused by anything that destabilizes the soil or rock on a slope, such as an earthquake, heavy rainfall, deforestation, or even the vibrations from machinery. But the dense forests on the mountainside above Guinsaugon showed no signs of logging, and recent earthquakes had been too minor to cause such a large landslide.

Characterizing a landslide
Stephen Evans, a professor of Earth sciences at the University of Waterloo in Canada, has studied landslides around the world, visiting sites and analyzing post-landslide data. In March 2006, he and his team visited Guinsaugon, on Leyte Island in the Philippines. “We gained insight into the mechanism of the failure that we couldn’t get without actually being on the ground itself,” Evans said. Triggers related to tectonic weakening of the Earth’s surface, for instance, are difficult to confirm without fieldwork. The landslide occurred on an active fault line that is creeping at a rate of 2.5 centimeters (1 inch) per year. That may seem slow, but over time the movement grinds and breaks up the rock, affecting the stability of surrounding slopes and making them more prone to landslides. Indeed, Evans’ field research and photos confirmed this weakening, showing broken, fragmented, and finely ground landslide debris. “Tectonic weakening was a preconditioning factor making that slope susceptible to catastrophic failure,” Evans said.

Evans also used his ground observations to validate what he had observed in remotely sensed data. Before departing for Leyte Island, he and his team obtained satellite data that provided topographic information and optical views of pre- and post-landslide Guinsaugon. In the field, Evans and his team compared the data to their measurements of the vertical landslide descent, the horizontal run-out distance, and the landslide volume. “We found the remotely-sensed data to be amazingly accurate,” Evans said. “Angles that we measured in the field, from the tip of the debris to the top of the slide, were exactly the same as what we saw in the topographic data.”
Rainfall as a trigger
To investigate rainfall as a potential trigger, Evans also referred to satellite imagery from TRMM. The TRMM image revealed that, in Guinsaugon, more than sixty-eight centimeters (twenty-seven inches) of rain had fallen between February 4, 2006, and February 17, 2006. “This was excessive rainfall beyond the monthly averages—more than twice as much,” Evans said. However, the heaviest rainfall occurred between February 8, 2006, and February 12, 2006, ending four days before the landslide. “The lag time was important, indicating that the rainfall in this situation was a preconditioning factor that led to failure,” Evans said. He said that landslides occur all the time and that direct triggers do not always exist; however, the excessive rainfall on Leyte Island definitely was a factor.
“The remote sensing data was amazing for analyzing this landslide,” Evans said. “Because of cloud conditions, we couldn’t fly over the area, so there would have been no other way of getting this data.” This was the first time he had included TRMM data in his research. “It’s very exciting to apply TRMM in the landslide hazard research field. I think it could become a major tool for analyzing landslides that occur in the tropical region,” Evans said.
Experimental development
Adler and Hong’s research contributed to the development of the TRMM Real-Time Multi-Satellite Precipitation Analysis (TMPA-RT) product. The TMPA-RT data, currently available online from 2002 through the present, are updated in real time, allowing users to determine if an area is currently receiving particularly intense rainfall or has reached a critical level of accumulation. However, Adler and Hong stress that the product is still experimental. Adler said, “This is a very new approach. We certainly need to do a substantial amount of evaluation to understand the product’s potential, and also its limitations.”
Even in its experimental status, researchers and agencies are using the TMPA-RT system to assess landslide and flood hazards. For instance, the Mekong River Commission, a partner in the Asia Flood Network, began downloading TMPA-RT data in 2003 to help calculate rainfall totals for the Mekong River basins in Cambodia, Laos, Thailand, and Vietnam. Making the satellite data available helps supplement conventional ground-based rain-gauge networks that do not provide enough coverage. Hong said, “Developing countries don’t often have ground information for rainfall available, so satellite data is the only source.”
In addition, a research group at Tennessee Technological University is assessing TMPA-RT data to help gauge precipitation and flooding in more than 250 river basins worldwide. Many large river systems cross international borders, meaning that downstream countries often need to negotiate with their upstream neighbors to access critical flood hazard information. Using satellite data can be an easier and more cost effective method to observe conditions along an entire river basin, proving critical when upstream nations lack adequate information.

Future research
Adler and Hong plan to refine the TMPA-RT system to make it more useful to local governments and organizations on the ground. And for landslide-prone areas like Leyte Island, this research may ultimately save lives. As with many mountainous areas in the tropics, timely landslide hazard assessment may be difficult to accomplish without satellite data. Adler said, “This system will be valuable when national and international organizations have to plan disaster mitigation or relief work. It can give them quantitative information about where exactly the hazard is and which areas are affected. And that’s why I think that a lot of people are looking at this information. You don’t get it anywhere else.”
The online TMPA-RT data provides an easy way for people to download text files or zoom into geographic maps that display three-hour rainfall rates or seven-day accumulations. In addition, Hong is making hourly rainfall data available through Google Earth. Hong said, “We’re looking at using this product to predict landslides in an operational way. That’s the ultimate goal, and this is our first evaluation of the potential.”
British Broadcasting Company News. What caused the Philippines landslide? http://news.bbc.co.uk/2/hi/asia-pacific/4723770.stm . Accessed January 16, 2007.
Evans, S. G., R. H. Guthrie, N. J. Roberts, and N. F. Bishop. 2007. The disastrous 17 February 2006 rockslide-debris avalanche on Leyte Island, Philippines: a catastrophic landslide in tropical mountain terrain. Natural Hazards Earth System Science 7: 89–101.
Hong, Y., R. Adler, and G. Huffman. 2006. Evaluation of the potential of NASA multi-satellite precipitation analysis in global landslide hazard assessment. Geophysical Research Letters 33, L22402, doi:10.1029/2006GL028010 .
Hong, Y., R. F. Adler, and G. J. Huffman. 2007. An experimental global monitoring system for rainfall-triggered landslides using satellite remote sensing information. IEEE Transactions on Geoscience and Remote Sensing 5(6), doi:ntrs.nasa.gov/search.jsp?R=20070017889 .
Hong, Y., R. Adler, and G. Huffman. 2007. Use of satellite remote sensing data in the mapping of global landslide susceptibility. Natural Hazards 43(2): 245-256, doi:10.1007/s11069-006-9104-z .
For more information
NASA Goddard Earth Sciences Data and Information Services Center ( GES DISC )
Tropical Rainforest Measuring Mission ( TRMM )
Experimental Real-Time TRMM Multi-Satellite Precipitation Analysis ( TMPA-RT )
Adler and Hong also used NASA Shuttle Radar Topography Mission (SRTM) digital elevation models (DEMs), NASA's Moderate Resolution Imaging Spectroradiometer (MODIS) vegetation data, and soil properties from the Digital Soil Map of the World.
Data Archives
NASA tracks nearly every aspect of the water cycle
You might also be interested in


Energy. Environment. Economy.
A reporting project of npr member stations.

A thunderstorm in Harrisburg on June 3, 2023 caused minor flooding on Front Street at Boas Street.
Rachel McDevitt / StateImpact Pennsylvania
Heaviest Pa. storms drop 60% more rain than they used to, report says

Rachel McDevitt / StateImpact Pennsylvania
Pennsylvania’s severe rainstorms are more extreme than they were decades ago.
A report from the nonprofit science communication group Climate Central says climate change is causing the heaviest storms in Pennsylvania and other northeastern states to drop 60% more rain than they did six decades ago.
That’s because a warmer atmosphere can hold more moisture, which can fuel heavy rain events and flash floods.
Climate Central determined the figure by looking at total precipitation totals on the heaviest 1% of days across the country, as found in the U.S. Global Change Research Program’s Fifth National Climate Assessment.
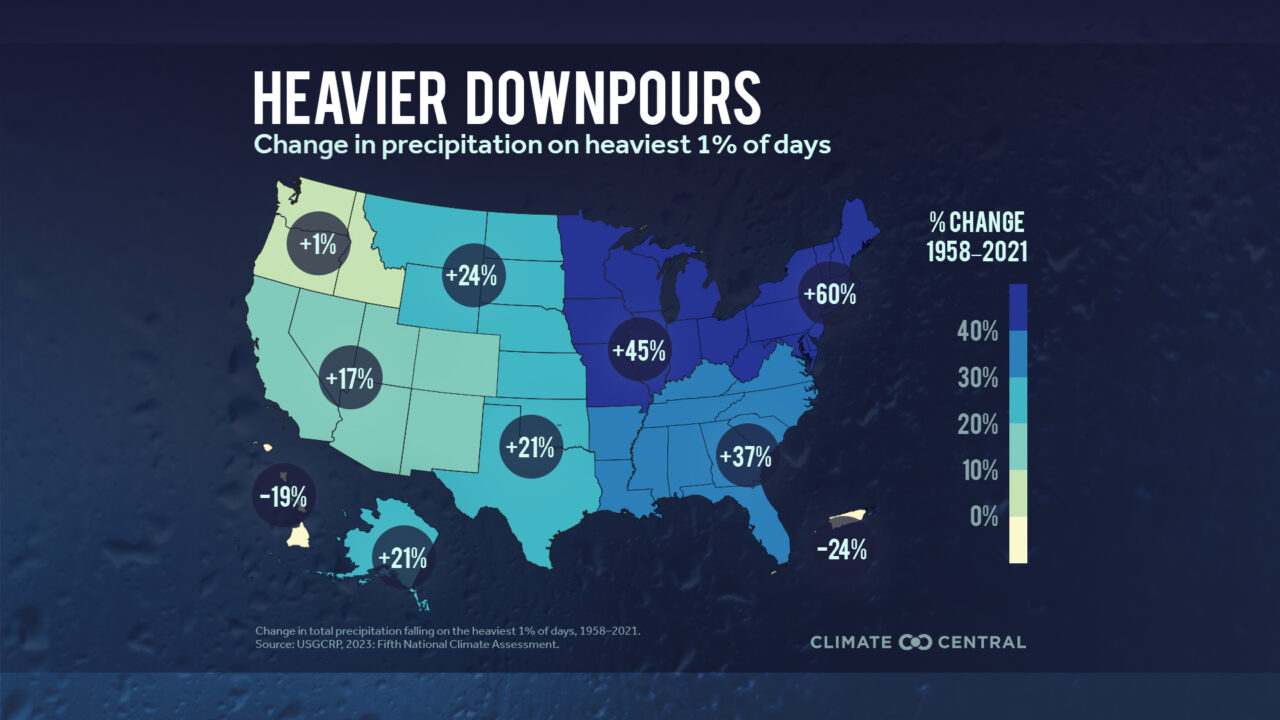
Greg Carbin, chief of forecast operations at the National Weather Service Weather Prediction Center, was not involved in the report. He said it’s helpful to think of the atmosphere as a series of streams, not as a sponge.
“This constant supply of water vapor stays out there. It’s not like it gets used up in any one event,” he said. That means more water is available to feed into storms.
Carbin said forecasters have relied on historic weather data to predict the strength of future storms, but changing conditions are making that harder to do accurately.
“How can we forecast an event that we’ve never forecast before?” Carbin said.
Carbin said it can be difficult to get people to recognize how dangerous a rain event is, but flooding can destroy homes, sweep away cars, and claim lives.
The remnants of Hurricane Ida in 2021 killed five people in Pennsylvania. Three people drowned; one after his car got stuck in a flooded creek. One died after a tree fell on her house.
A flash flood in Bucks County in July last year killed seven people. Near the same time, Antietam Middle Senior High School in Berks County was inundated with at least two feet of water. The school was not able to open to students for the 2023-24 school year.
Climate Central reports flood damage cost Pennsylvania nearly $2.8 billion in 2020. That could rise 8% by 2050 as global temperatures continue to rise.
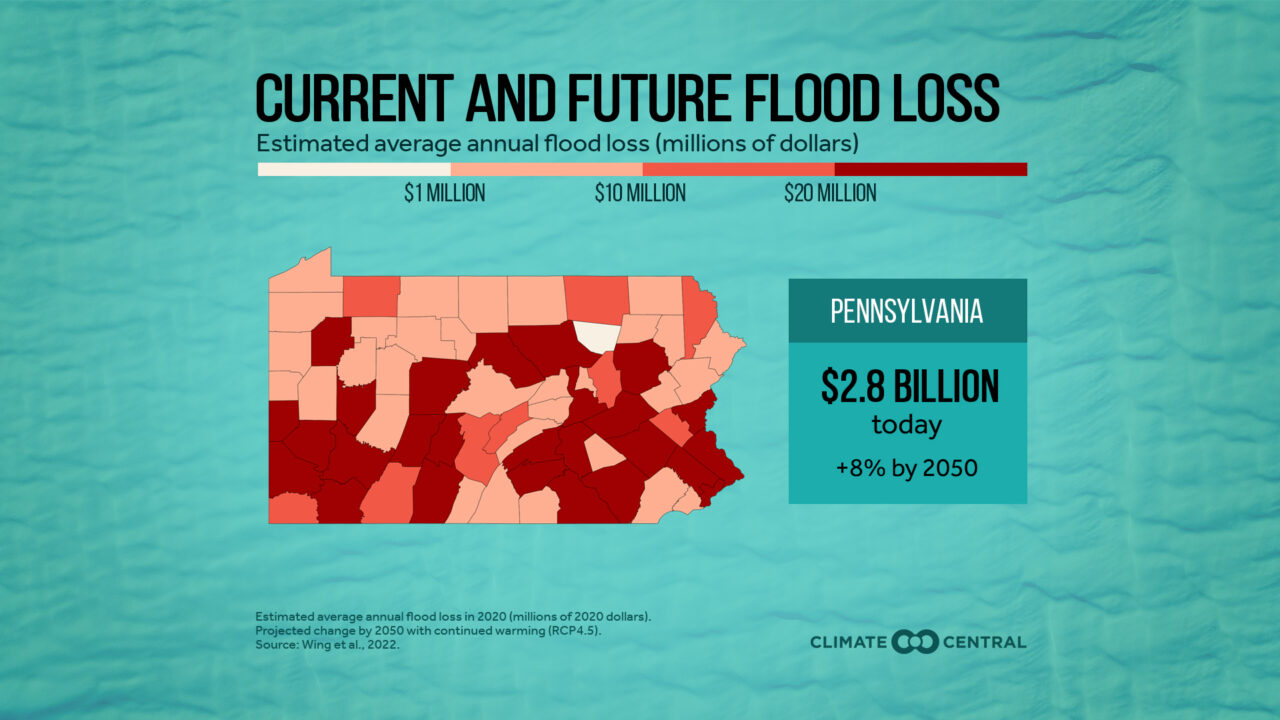
Christine Kirchhoff, a civil and environmental engineering professor at Penn State who also was not part of the study, said communities need to rethink storm management. She said the management systems in place now were designed for conditions decades ago.
“What we might be thinking we need to adapt to today may change over time so we have to be able to not be paralyzed,” Kirchhoff said.
One solution, she said, could be infrastructure that can absorb and hold water during storms, rather than transporting all of it somewhere else.
Kirchhoff said both retrofits and smart stormwater management for new construction will be needed to help address an increase in rain and flooding.
Editor's Picks
Centralia, wash.’s coal plant has to close next year. can pa. communities learn from centralia’s transition, coal transition: how a weatherization grant helped a music venue build community, coal transition: betting on hydrogen with an energy technology grant, coal transition: raising fish and a workforce with an economic development grant, about stateimpact pennsylvania.
StateImpact Pennsylvania is a collaboration among WITF , WHYY , and the Allegheny Front . Reporters Reid Frazier , Rachel McDevitt and Susan Phillips cover the commonwealth’s energy economy. Read their reports on this site, and hear them on public radio stations across Pennsylvania.

Climate Solutions partners
(listed by story count)
- The Marcellus Shale, Explained 873
- The Pennsylvania Guide to Hydraulic Fracturing, or 'Fracking' 740
- DEP: The Department That Regulates and Oversees Drilling 654
- Climate Change 581
- Delaware Watershed 454
- Mariner East: A pipeline project plagued by mishaps and delays 301
- Pipelines: The new battleground over fracking 216
- Your guide to pipelines 201
- Gov. Tom Wolf 185
- Tom Corbett (Pa. governor, 2011-2015) 169

Climate Solutions , a collaboration of news organizations, educational institutions and a theater company, uses engagement, education and storytelling to help central Pennsylvanians toward climate change literacy, resilience and adaptation. Our work will amplify how people are finding solutions to the challenges presented by a warming world.
StateImpact Pennsylvania Team

Why are floods in KwaZulu-Natal so devastating?
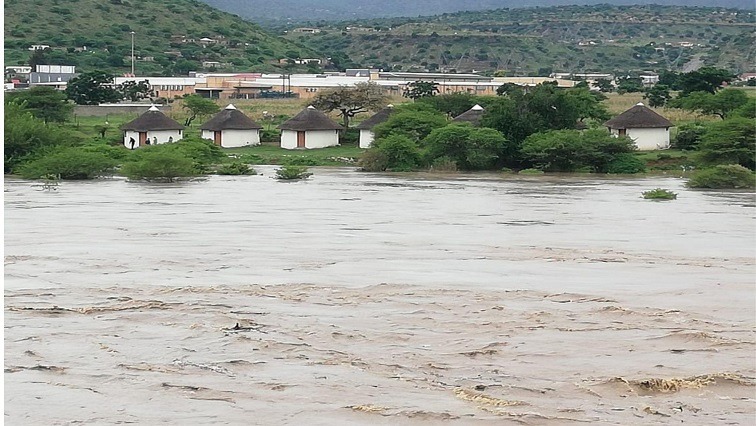
- Flooded area in KZN
- Image Credits :
- The Conversation
- 20 January 2024, 20:18 [SAST]
The devastation caused by the recent floods in KwaZulu-Natal, South Africa demonstrates again that the country is not moving fast enough to adopt appropriate urban planning. It should be integrating risk assessment and management in the design and development of cities. This is becoming more urgent as the frequency of floods increases.
Most South African cities were built a long time ago, before climate change was predicted. KwaZulu-Natal experienced flooding in July 2016, May 2017, October 2017, March 2019, April 2019, November 2019, November 2020, April 2023, June 2023, and now in January 2024. South Africa has a comprehensive national climate change adaptation strategy, and the authorities are aware of flood damage, but are not able to keep up with the repairs.
I recently edited a book on inclusive cities in which I write about the way South Africa has dealt with natural disasters. There is a lack of risk-informed urban planning. This is an approach to designing and developing urban areas with risk in mind. It aims to create resilient cities that can withstand and adapt to various hazards and challenges, such as natural disasters, climate change and social vulnerabilities.
Cities are not resilient
The devastation caused by the recent floods indicates lack of resilience and increasing social vulnerabilities. More than 45 people have died in the last two months; more than 250 homes have been severely damaged. Severe flooding and landslides caused by heavy rainfall caused the deaths of at least 459 people in April 2022. These floods displaced over 40,000 people, destroyed over 12,000 houses, and left 45,000 people temporarily unemployed.
The cost of infrastructure and business losses amounted to about US$2 billion. It was one of the worst flooding events in KwaZulu-Natal’s recorded history and eThekwini (Durban) was the worst affected city in the province.
Climate change means more floods are coming
Studies and scientific evidence have pointed to one significant factor contributing to the occurrence of severe flooding: climate change. 2023 was the hottest year ever recorded. The concentration of carbon emissions in the atmosphere has resulted in drastic shifts in weather patterns, leading to increased rainfall in places and subsequent floods.
In KwaZulu-Natal, the failure to practise risk-informed urban planning has left the province’s roads and buildings, often poorly designed, crumbling. The authorities have failed to maintain drainage systems. They have not put in place flood control measures, such as river channelisation. This is where rivers are dredged, widened and deepened to improve their flow capacity and reduce the risk of flooding.
Flood retention basins, designed to temporarily store excess water during heavy rainfall or flooding events, would also reduce the risk of downstream flooding. Neglecting to put these measures in place contributes to severe flooding and endangers the safety of communities.
Inadequate waste collection and inappropriate disposal of garbage also blocks the drains, worsening the impact of heavy rainfall. Poor drainage systems are clogged with plastic pollution. Robust waste management systems are needed to ensure that water flows properly through these drains.
In some cases, inappropriate land use and the unchecked expansion of urban areas into flood-prone zones have resulted in increased vulnerability to extreme weather. Strong enforcement of land use policies that restrict development in high-risk areas is essential. Municipalities such as the disaster-hit city of eThekwini in KwaZulu-Natal must not allow people to build in flood-prone areas, because once people settle in an area it becomes expensive to relocate them.
What are the solutions?
Frequent flooding in KwaZulu-Natal will be the new reality. The province urgently needs a comprehensive approach, one that involves the local community in decision-making around urban planning and climate change mitigation. An inclusive approach would recognise local knowledge and encourage innovative solutions suitable for the area.
Prioritising mixed-use development, density, and the preservation of green spaces in city zoning and land-use regulations is essential. Urban sprawl must be curbed. The government must establish compact, walkable neighbourhoods that are not constructed on floodplains, coastal zones, or low-lying areas. By recognising areas of high risk, the damage caused by flooding can be minimised.
Water-sensitive urban design must be encouraged as soon as possible. This includes green roofs and permeable pavements, which allow water to pass through the surface layer and be stored or infiltrated into the underlying soil layers.
More parks, urban forests and other green spaces must be established in cities and towns. They serve as carbon sinks: places that store carbon dioxide, acting as natural reservoirs, and regulating the balance of greenhouse gases. Wetlands, riparian zones and forests must be preserved because they can act as natural buffers against flooding, absorbing excess water and reducing the impact on nearby urban areas.
Developing an efficient network of stormwater drains, sewers and retention ponds to control the flow of water during heavy rainfall events is vital. This infrastructure should be regularly maintained and updated.
The province needs to move towards climate change adaptation. Public awareness and education campaigns on the importance of flood-resistant measures will foster a sense of responsibility in preventing flooding.
Hope Magidimisha-Chipungu , Full Professor, University of KwaZulu-Natal
This article is republished from The Conversation under a Creative Commons license. Read the original article .

View all posts
RELATED STORIES
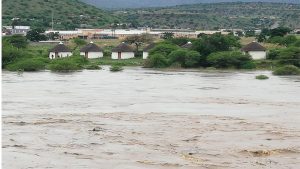
KZN DCoG looks at long-term solution to flooding issue
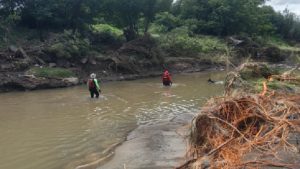
CoGTA Minister declares flood ravaged districts in KZN disaster areas
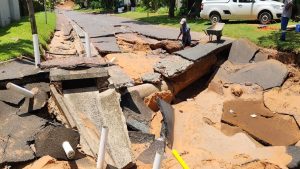
KZN Premier commends work done by disaster management teams
Body of man washed away during flash floods in kzn found.
Essay on Effects of Heavy Rainfall
Students are often asked to write an essay on Effects of Heavy Rainfall in their schools and colleges. And if you’re also looking for the same, we have created 100-word, 250-word, and 500-word essays on the topic.
Let’s take a look…
100 Words Essay on Effects of Heavy Rainfall
Introduction.
Heavy rainfall is a natural phenomenon that can have a significant impact on our environment and daily lives.
Effects on Environment
Heavy rains can cause soil erosion, leading to loss of fertile land. This can affect plant growth and disrupt ecosystems.
Impact on Human Life
Heavy rains can lead to floods, causing damage to homes and infrastructure. It can disrupt transportation, making it difficult for people to go to school or work.
While heavy rainfall is necessary for replenishing water supplies, its extreme effects can be detrimental. Therefore, it’s essential to have proper planning and infrastructure to mitigate these effects.
250 Words Essay on Effects of Heavy Rainfall
Rainfall is a fundamental natural process that sustains life by replenishing water bodies and maintaining the hydrological cycle. However, heavy rainfall, often associated with storms and cyclones, can have severe effects on both the natural environment and human society.
Environmental Impacts
Excessive rainfall can lead to soil erosion, particularly in hilly areas where the natural gradient accelerates water flow. This process not only depletes the fertile topsoil but also leads to sedimentation of rivers, affecting aquatic ecosystems. Moreover, it can cause landslides, disrupting the habitat of various species and sometimes leading to loss of biodiversity.
Societal Consequences
Heavy rainfall also has profound societal impacts. It often results in flooding, which can lead to loss of life and property. Infrastructure like roads, bridges, and buildings can be severely damaged, disrupting normal life and causing economic losses. Moreover, floods can lead to outbreaks of waterborne diseases, posing a significant public health risk.
Climate Change Connection
With the intensifying climate change, the frequency and intensity of heavy rainfall events are predicted to increase. This calls for adaptive strategies, like improved infrastructure design, effective early warning systems, and sustainable land-use practices to mitigate the adverse effects of heavy rainfall.
While rainfall is vital for life, its excessive occurrence can lead to environmental degradation and societal disruption. Therefore, understanding the effects of heavy rainfall and developing strategies to deal with them is crucial in the era of climate change.
500 Words Essay on Effects of Heavy Rainfall
Rainfall is a vital natural phenomenon that replenishes water resources, nourishes ecosystems, and sustains life. However, when it becomes unusually heavy, it can lead to a myriad of adverse effects, ranging from environmental to socio-economic and health-related issues.
Environmental Impact
Heavy rainfall significantly influences the environment. One of the most immediate impacts is flooding. When the rainfall exceeds the soil’s absorption capacity and the capacity of rivers and lakes, it results in water overflow, leading to floods. Flooding can cause extensive damage to the natural environment, including soil erosion, loss of habitats, and death of flora and fauna.
Furthermore, heavy rainfall can lead to landslides in hilly areas, causing massive destruction. It can also alter the landscape by washing away fertile topsoil and degrading the quality of land, which can have long-term effects on agricultural productivity.
Socio-economic Consequences
The socio-economic impacts of heavy rainfall are profound. Flooding and landslides can destroy homes, infrastructure, and public utilities, leading to displacement of people and loss of livelihoods. In agricultural societies, heavy rains can ruin crops, leading to food shortages and economic losses.
Moreover, the cost of rebuilding and recovery after the destruction caused by heavy rainfall can be astronomical, straining the economy. It can lead to increased public expenditure, diverting funds from other vital sectors like education and healthcare.
Health Risks
Heavy rainfall also poses serious health risks. It can lead to the contamination of water sources, increasing the risk of waterborne diseases like cholera, typhoid, and dysentery. The stagnant water left after floods can become breeding grounds for mosquitoes, leading to an increase in vector-borne diseases like malaria and dengue.
Furthermore, heavy rainfall and resultant floods can cause injuries and loss of life. The mental health impact is also significant, with affected individuals often experiencing stress, anxiety, and post-traumatic stress disorder (PTSD).
In the context of climate change, scientists predict an increase in the frequency and intensity of heavy rainfall events. This is due to the higher capacity of warmer air to hold moisture, leading to more intense precipitation. Therefore, understanding and mitigating the effects of heavy rainfall becomes even more crucial in the face of global warming.
While heavy rainfall is a natural occurrence, its effects can be devastating on multiple fronts. It underscores the need for robust disaster management strategies, sustainable environmental practices, and climate change mitigation efforts. By doing so, we can hope to minimize the adverse impacts of heavy rainfall and safeguard our environment and communities for future generations.
That’s it! I hope the essay helped you.
If you’re looking for more, here are essays on other interesting topics:
- Essay on A Day of Heavy Rainfall
- Essay on Space Travel
- Essay on Space Tourism
Apart from these, you can look at all the essays by clicking here .
Happy studying!
Leave a Reply Cancel reply
Your email address will not be published. Required fields are marked *
Save my name, email, and website in this browser for the next time I comment.

- English Conversation Lessons
- English Essay Topics
- English Autobiography Examples
- Report Writing
- Letter Writing
- Expansion of Ideas(English Proverbs)
- English Grammar
- English Debate Topics
- English Stories
- English Speech Topics
- English Poems
- Riddles with Answers
- English Idioms
- Simple English Conversations
- Greetings & Wishes
- Thank you Messages
- Premium Plans
- Student’s Log In
. » Report Writing » Heavy Rains in Mumbai
Report Writing: Heavy Rains in Mumbai Causing Disruption
Our website offers an opportunity for students to learn how to write effective reports on real-world events by using the example of heavy rains in Mumbai causing disruption to normal life and railways. Our report writing service provides an in-depth analysis of the situation, including the causes, effects, and potential solutions to mitigate the impact of heavy rains. Our experienced writers will guide students in organizing their ideas, presenting data, and drawing conclusions. The report will also provide valuable insights into the writing process, including tips for research, data analysis, and effective communication. Our service is ideal for students who want to improve their report writing skills and receive top grades on their assignments.

Mumbai Hit by Heavy Rains Causing Disruption to Normal Life and Railways
Date: July 26, 2023
Resource: Hindustan Times
Mumbai, the financial capital of India, experienced heavy rains on July 25, 2023, leading to disruptions in normal life and the railways. The sudden downpour resulted in waterlogging in several areas of the city, causing inconvenience to residents and affecting the local train services, which are a lifeline for millions of commuters in Mumbai.
According to the meteorological department, Mumbai received heavy rainfall on April 25, with some areas recording over 100 mm of rainfall in just a few hours. The heavy downpour led to waterlogging in low-lying areas, resulting in traffic snarls and disruption of public transportation. Many roads were submerged, causing difficulties for commuters and pedestrians alike.
The local train services, which are crucial for daily commuters in Mumbai, were also severely impacted by the heavy rains. Waterlogging on railway tracks and flooding at some stations disrupted the train services on multiple routes, resulting in delays and cancellations of trains. This led to overcrowding at some stations and inconvenience for commuters who were left stranded.
The authorities were quick to respond to the situation, with personnel from the Brihanmumbai Municipal Corporation (BMC) and other agencies working round-the-clock to pump out water from the waterlogged areas and clear the blocked drains. The railways also deployed additional staff and equipment to restore the train services as quickly as possible.
In addition to the disruptions in transportation, the heavy rains also caused power outages in some areas of Mumbai, further adding to the inconvenience faced by the residents. However, despite the challenges, Mumbaikars demonstrated their resilience and cooperation, with people helping each other and authorities working diligently to restore normalcy.
This incident serves as a reminder of the need for better urban planning, drainage systems, and preparedness to tackle heavy rainfall events in Mumbai, which is prone to monsoonal rains every year. It also underscores the importance of maintaining and upgrading the city’s infrastructure, including the railways, to mitigate the impact of such weather events on the normal life of the residents.

English Courses
- Mom & Son Breakfast Talk
- Dad & Son Breakfast Talk
- Going Out for Breakfast
- Healthy Breakfast Ideas
- Breakfast Table Conversation
- Talking about Household Chores
- Power Outage Conversation
- Speaking About Vegetables
- Talk About Television
- Telephone Conversation in English
- Renting an Apartment Vocabulary
- Talking about Pets
- Self Introduction Conversation
- Introduce Yourself in English
- Morning Walk Conversation
- Make New Friends Conversation
- English Speaking with Friends
- Conversation Between Siblings
- Talking about Smartphones
- Talking About City Life
- English Conversation on the Bus
- Talking about Dust Allergy
- Talking about Food Allergies
- Brushing Teeth Conversation
- Replacing Worn out Toothbrush
- Brushing Teeth with Braces
- Switching to Herbal Toothpaste
- Benefits of using Tongue Cleaner
- Talking about Illness
- Talking about Fitness and Health
- Talking About Fitness for Kids
- Visiting a Doctor Conversation
- Speaking about Lifestyle
- Conversation about Air Pollution
- Using an ATM Conversation
- Opening a Bank Account
- Car Accident Conversation
- Talking about Accident
- Exam Conversation with Kids
- At the Library Conversation
- Talking about Studies
- Offline vs Online School
- Internet Vocabulary and Dialogues
- Advantages of Homeschooling
- Inviting for Birthday Party
- Phone Conversation
- Asking for Directions
- Conversation on the Plane
- At the Airport Conversation
- Lost and Found Conversation
- Museum Vocabulary
- Conversation about Traffic
- Order Food Over the Phone
- At the Restaurant Conversation
- Talking about Music
- English Music Vocabulary
- Talk on Music Band
- Shopping for Clothes
- Buying a Smartphone
- Ordering Flowers Conversation
- English Conversation in Vegetable Market
- At the Supermarket
- At the Pharmacy
- Friends Talking about Chess
- Importance of Outdoor Activities
- Talking About Football
- Weekend Plans Conversation
- At the Beach Conversation
- New Job Conversation
- Business English Conversation
- Expressing Boredom in English
- English Conversation at the Salon
- English Speaking at the Bakery
- Talking About Studies
- Siblings Studying Together
- Speaking about Outdoor Activities
- Talk About Photography
- Essay on My School
- Essay on Summer Vacation
- Essay on Time Management
- Essay on Hard Work
- Essay on Health is Wealth
- Essay on Time is Money
- Republic Day Essay
- Essay on My Hobby
- Essay on Myself
- Essay on My Teacher
- Essay on My Best Friend
- Essay on My Family
- Essay on My Mother
- Essay on My Father
- Essay on Friendship
- Essay on Global Warming
- Essay on Child Labor
- Essay on Mahatma Gandhi
- Essay on Holi
- Essay on Pollution
- Essay on Education
- Essay on Air Pollution
- Essay on Communication
- Essay on Doctor
- Essay on Environment
- Essay on Gender Inequality
- Essay on Happiness
- Essay on Healthy Food
- Essay on My Favorite Festival Diwali
- Essay on My Favorite Sport
- Essay on My Parents
- Essay on Overpopulation
- Essay on Poverty
- Essay on Travelling
- Essay on Unemployment
- Essay on Unity in Diversity
- Essay on Water Pollution
- Essay on Water
- Essay on Women Empowerment
- Essay on Yoga
- Essay on Christmas
- Autobiography of a Book
- Autobiography of a Brook
- Autobiography of a Camera
- Autobiography of a Cat
- Autobiography of a Classroom
- Autobiography of a Coin
- Autobiography of a Dog
- Autobiography of a Doll
- Autobiography of a Farmer
- Autobiography of a Flower
- Autobiography of a Football
- Autobiography of a Haunted House
- Autobiography of a House
- Autobiography of a Kite
- Autobiography of a Library
- Autobiography of a Mobile Phone
- Autobiography of a Mosquito
- Autobiography of a Newspaper
- Autobiography of a Pen
- Autobiography of a Pencil
- Autobiography of a River
- Autobiography of a Table
- Autobiography of a Tiger
- Autobiography of a Tree
- Autobiography of an Umbrella
- Autobiography of Bicycle
- Autobiography of Bird
- Autobiography of Chair
- Autobiography of Clock
- Autobiography of Computer
- Autobiography of Earth
- Autobiography of Lion
- Autobiography of Peacock
- Autobiography of Rain
- Autobiography of a Soldier
- Autobiography of Sun
- Autobiography of Water Bottle
- Autobiography of Water Droplet
- Adopting a Village
- Teaching Children in an Adopted Village
- Programs Organized in an Adopted Village
- Volunteering in an Adopted Village
- Activities in an Adopted Village
- School Annual Day Celebration
- Republic Day Celebration
- Teachers Day Celebration
- World Environment Day Celebration
- Children’s Day Celebration
- Visiting the Wild Animal Rehabilitation Centre
- The Animal Sanctuary Visit
- Animal Shelter Visit
- Animal Rescue Center Visit
- Adult Literacy Camp
- Burglary of Jewelry
- India Wins Test Match
- School Children Affected by Food Poisoning
- Heavy Rains in Mumbai
- School Children Injured in Bus Accident
- Complaint Letter to the Chairman of Housing Society
- Request Letter to the Municipal Corporation
- Complaint Letter to the State Electricity Board
- Suggestion Letter to the Chief Minister
- Request Letter to the District Collector
- Request Letter to the Commissioner of Police
- Application Letter for an Internship
- Application Letter for a Job
- Request Letter for a Character Certificate
- Request Letter for a Better Lab and Library
- Global Warming Debate
- Animal Rights Debate
- Climate Change Debate
- Gun Control Debate
- Role of Religion in Society Debate
- Republic Day Speech
- Poems about Life
- Poems about Nature
- Poems for Boys
- Poems for Girls
- Poems for Mothers
- Poems for Friends
- Poems for Kids
- Poems about Trees
- Poems about Peace
- Funny Poems
- Poems About Climate Change
- Poems about Dreams
- Poems about Education
- Poems about Environment
- Poems about Eyes
- Poems about Family
- Poems about Fear
- Poems about Feminism
- Poems about Flowers
- Poems about Freedom
- Poems about Friendship
- Poems about Happiness
- Poems about History
- Poems about Hope
- Poems about India
- Poems about Joy
- Poems about Loneliness
- Poems about Love
- Poems about Night
- Poems about Power
- Poems about Water
- Poems about Women Empowerment
- Poems about Women’s Rights
- Poems on Earth
- Poems on Home
- Poems on Honesty
- Poems on Humanity
- Poems on Jungle
- Poems on Kindness
- Poems on Mental Health
- Poems on Moon
- Poems on Music
- Poems on Patriotism
- A Bad Workman Always Blames His Tools
- A Bird in the Hand is Worth Two in the Bush
- A Fool and His Money Are Soon Parted
- A Penny Saved is a Penny Earned
- A Picture is Worth a Thousand Words
- A Stitch in Time Saves Nine
- A Watched Pot Never Boils
- Absence Make the Heart Grow Fonder
- Actions Speak Louder than Words
- All Good Things Come to Those Who Wait
- All Good Things Must Come To an End
- All Is Fair in Love and War
- All That Glitters is Not Gold
- All’s Well That Ends Well
- An Apple a Day Keeps the Doctor Away
- An Empty Vessel Makes Much Noise
- An Idle Mind is Devil’s Workshop
- As You Sow, So Shall You Reap
- Barking Dogs Seldom Bite
- Beauty is in the Eye of the Beholder
- Beggars can’t be Choosers
- Better Late than Never
- Better the Devil You Know than the Devil You Don’t
- Birds of a Feather Flock Together
- Blood is Thicker than Water
- Boys will be Boys
- Charity Begins at Home
- Cleanliness is Next to Godliness
- Curiosity Killed the Cat
- Don’t Bite Off More than You Chew
- Don’t Bite the Hand that Feeds You
- Don’t Blow Your Own Trumpet
- Don’t Count your Chickens Before They Hatch
- Don’t Cry Over Spilled Milk
- Don’t Judge a Book by its Cover
- Don’t Put All Your Eggs in One Basket
- Don’t Put the Cart Before the Horse
- Don’t Throw The Baby Out With the Bathwater
- Early to Bed and Early to Rise Makes a Man Healthy, Wealthy, and Wise
- Easy Come, Easy Go
- Every Cloud Has a Silver Lining
- Every Dog Has His Day
- Fools Rush in Where Angels Fear to Tread
- Fortune Favors the Bold
- Give a Man a Fish, and You Feed Him for a Day; Teach a Man to Fish, and You Feed Him for a Lifetime
- Give Credit Where Credit is Due
- God Helps Those Who Help Themselves
- Half a Loaf is Better Than None
- Haste Makes Waste
- Health is Wealth
- Honesty is the Best Policy
- If at First You Don’t Succeed, Try, Try Again
- If It ain’t Broke, Don’t Fix It
- If the Shoe Fits, Wear It
- If you can’t Beat them, Join them
- If you Want Something Done Right, Do It Yourself
- Ignorance is Bliss
- It ain’t Over Till the Fat Lady Sings
- It Takes Two to Tango
- It’s a Small World
- It’s Always Darkest Before the Dawn
- It’s Better to Ask Forgiveness than Permission
- Its Better to Be Safe than Sorry
- It’s Better to Give than to Receive
- It’s Never Too Late to Mend
- It’s not What you Know, it’s Who you Know
- Jack of All Trades, Master of None
- Keep Your Friends Close and Your Enemies Closer
- Keep Your Mouth Shut and Your Eyes Open
- Kill Two Birds with One Stone
- Knowledge is Power
- Laughter is the Best Medicine
- Leave No Stone Unturned
- Let Sleeping Dogs Lie
- Life is a Journey, Not a Destination
- Life is Like a Box of Chocolates; You Never Know What You’re Gonna Get
- Like Father, Like Son
- Look Before You Leap
- Love Conquers All
- Make Hay While The Sun Shines
- Money Can’t Buy Happiness
- Money Doesn’t Grow on Trees
- Money Talks
- Necessity is the Mother of Invention
- No Man is an Island
- No Pain, No Gain
- Nothing Ventured, Nothing Gained
- One Man’s Trash is Another Man’s Treasure
- Out of Sight, Out of Mind
- Patience is a Virtue
- Practice Makes Perfect
- Prevention is Better than Cure
- Rome Wasn’t Built in A Day
- Slow and Steady Wins the Race
- The Early Bird Catches the Worm
- The Grass is Always Greener on the Other Side
- The Pen is Mightier Than the Sword
- The Proof of the Pudding is in the Eating
- There is No Place Like Home
- There’s No Time Like the Present
- Time Heals All Wounds
- Time is Money
- Too Many Cooks Spoil the Broth
- Two Heads are Better than One
- When in Rome, do as the Romans do
- Where There’s Smoke, There’s Fire
- You Can Lead a Horse to Water, But You Can’t Make it Drink
- You Can’t Have Your Cake and Eat It Too
- You Can’t Make an Omelet Without Breaking Eggs
- You Scratch My Back, And I’ll Scratch Yours
- You’re Never Too Old to Learn
- You’re Only As Strong As Your Weakest Link
- Parts of Speech
- Lola’s Dream
- Snowy Learns to Brave the Rain
- The Ant Explorer
- The Blind Archer
- The Brave Ant
- The Disguised King
- The Enchanted Blade
- The Enchanted Garden of Melodies
- The Endless Bag
- The Faithful Companion
- The Farmer’s Treasure
- The Frog and the Mischievous Fishes
- The Fruit Seller’s Fortune
- The Generous Monkey of the Forest
- The Gentle Giant
- A Blessing in Disguise
- A Dime a Dozen
- A Piece of Cake
- Apple of My Eye
- As Easy as Pie
- Back to the Drawing Board
- Beat Around the Bush
- Bite the Bullet
- Break a Leg
- Butterflies in My Stomach
- By the Skin of Your Teeth
- Caught Red-Handed
- Come Rain or Shine
- Cool as a Cucumber
- Cry over Spilled Milk
- Cut the Mustard
- Devil’s Advocate
- Down to the Wire
- Drink Like a Fish
- Eating Habits
- Supermarket
- Vegetable Market
- College Canteen
- Household Topics
- Diwali Festival
- Republic Day Wishes
- Birthday wishes for kids
- Birthday Wishes for Sister
- Birthday Wishes for Brother
- Birthday Wishes for Friend
- Birthday Wishes for Daughter
- Birthday Wishes for Son
- Women’s Day Wishes
- Thanks for Birthday Wishes
- Thank You Messages for Friends
- Thanks for Anniversary Wishes

Justin Morgan
Latest articles.
- Practical English Usage
- Overview of Babson University
- Babson University’s Entrepreneurship Program
- The Founding of Babson University
- Babson University’s Impact on the Global Economy
- Babson University’s Post-Pandemic Student Preparation
- Babson University’s Notable Alumni
- Babson University’s Business Research
- Campus Life at Babson University
- Babson University’s Leading Scholars and Experts
- Babson University’s Social Impact Program
- The Future of Babson University
- Top Programs at Cardiff University
- COVID-19 Research at Cardiff University
- Culture and Values of Cardiff University
- Class 6 Maths
- Class 6 Science
- Class 6 Social Science
- Class 6 English
- Class 7 Maths
- Class 7 Science
- Class 7 Social Science
- Class 7 English
- Class 8 Maths
- Class 8 Science
- Class 8 Social Science
- Class 8 English
- Class 9 Maths
- Class 9 Science
- Class 9 Social Science
- Class 9 English
- Class 10 Maths
- Class 10 Science
- Class 10 Social Science
- Class 10 English
- Class 11 Maths
- Class 11 Computer Science (Python)
- Class 11 English
- Class 12 Maths
- Class 12 English
- Class 12 Economics
- Class 12 Accountancy
- Class 12 Physics
- Class 12 Chemistry
- Class 12 Biology
- Class 12 Computer Science (Python)
- Class 12 Physical Education
- GST and Accounting Course
- Excel Course
- Tally Course
- Finance and CMA Data Course
- Payroll Course
Interesting
- Learn English
- Learn Excel
- Learn Tally
- Learn GST (Goods and Services Tax)
- Learn Accounting and Finance
- GST Tax Invoice Format
- Accounts Tax Practical
- Tally Ledger List
- GSTR 2A - JSON to Excel
Are you in school ? Do you love Teachoo?
We would love to talk to you! Please fill this form so that we can contact you
Report Writing (with Past Year Questions)
- Invitations - Formal and Informal (with Past Year Questions)
- Letter Writing - Formal (with Past Year Questions)
- Notice Writing - Formal (with Past Year Questions)
- Article Writing - Informal (with Past Year Questions)
Question 5 - Report Writing (with Past Year Questions) - Writing - English Class 12
Last updated at April 16, 2024 by Teachoo
Due to heavy rainfall, the river near your town started overflowing its banks. As a result, your town was flooded. It led to a great loss of life and property. Many N.G.O.s came forward to help the people with food, shelter, and medicines. Write a report in 120-150 words for a local newspaper on the tragedy and rescue efforts. You are Raghav/Ritika.

Maninder Singh
CA Maninder Singh is a Chartered Accountant for the past 14 years and a teacher from the past 18 years. He teaches Science, Economics, Accounting and English at Teachoo
Hi, it looks like you're using AdBlock :(
Please login to view more pages. it's free :), solve all your doubts with teachoo black.
Home / Essay Samples / Environment / Rain / The Effects Of Heavy Rainfall And How to Reduce Damage
The Effects Of Heavy Rainfall And How to Reduce Damage
- Category: Environment , Law
- Topic: Environmental Issues , Property , Rain
Pages: 2 (1049 words)
Views: 5015
- Downloads: -->
- Foundation damage- When the soil becomes wet it expands, pushing against your foundation. The constant moistness of the soil causes progressive expansion and when the pressure becomes too much, you would start noticing cracks and leaks on walls and foundation.
- The overflow of gutters- It can clog up gutters with the debris that is swept away with the heavy downpour
- Leaking roofs
- The dripping of water from cracks on walls can also ruin the foundation and result in water damage to the house.
- Mold growth: The wetness and dampness indoors tend to aid mold growth which can reduce the aesthetic value of the home and cause furniture, carpet, mattress damage.
Before the Storm
- Roof Inspection
- Gutters and Other drainage systems
- Ensuring a solid Foundation
- Use of Sandbags
- 6Purchase Flood insurance
During the Storm
- Inspect your property
- Gutters and downspouts
- Roofs if they are leaking
- Walls for any discoloration, peeling wallpaper, peeling paint.
- Report your Claim
--> ⚠️ Remember: This essay was written and uploaded by an--> click here.
Found a great essay sample but want a unique one?
are ready to help you with your essay
You won’t be charged yet!
Pollution Essays
Dust Bowl Essays
Water Conservation Essays
Global Warming Essays
Plastic Bags Essays
Related Essays
We are glad that you like it, but you cannot copy from our website. Just insert your email and this sample will be sent to you.
By clicking “Send”, you agree to our Terms of service and Privacy statement . We will occasionally send you account related emails.
Your essay sample has been sent.
In fact, there is a way to get an original essay! Turn to our writers and order a plagiarism-free paper.
samplius.com uses cookies to offer you the best service possible.By continuing we’ll assume you board with our cookie policy .--> -->