How To Conduct A UX Redesign
No matter what context you work in as a UX designer, at one point or another, you’ll probably be asked to redesign a user experience. At the start of your UX career, you might even conduct an unsolicited redesign to help build up your portfolio.
Either way, you might find yourself redesigning a website, an app, or the interface of a device. No matter what you’re redesigning, though, your process should follow a similar series of steps and encompass a similar set of questions and concerns.
In this article, we’ll cover the following topics:
- Redesigns from refresh to complete overhaul
- Reasons to conduct a redesign
- Steps for conducting a UX redesign
- Showcasing redesigns in your UX portfolio
- Key takeaways
Let’s jump in!

1. Redesigns from refresh to complete overhaul
UX redesigns can have vastly different degrees of complexity. On the one hand, the product may simply require a visual refresh to make it seem more modern and visually interesting. If this is the case and no noteworthy user experience changes are needed, the UX designer’s job may be to simply review the art director’s work and ensure nothing about the user experience is broken by the aesthetic overhaul.
You might also be tasked with redesigning the user experience for a specific part of a product’s user interface . For example, perhaps the users of a specific website are having trouble navigating through a shopping cart or finding information on shipping and handling. If that’s the case, the UX designer’s job is not only to redesign that piece of the user experience; it’s also to make sure the redesigned interface fits in seamlessly with the original interface and doesn’t break any links or other functionality on the product.
So if you’re redesigning the way a user books a table on a restaurant’s website, for instance, you need to make sure users can successfully navigate to your redesigned reservation system and that they can navigate away to a different part of the website once they’ve completed their booking.
Finally, a product might require a complete overhaul. That means the UX designer will be responsible for understanding every single piece of information that must go into the redesign and how that information fits together. Then the UX designer must determine how to improve upon the prior design while avoiding changes that are so radical that they confuse and frustrate the product’s existing users. It’s a tough balancing act that requires attention to detail and a deep understanding of users’ goals.
2. Reasons to conduct a redesign
The very first question a UX designer should ask clients or stakeholders about a redesign is why they want to conduct it. There are many legitimate reasons to conduct a redesign, according to the Nielsen Norman Group . These include:
- The site looks outdated
- New branding needs to be implemented
- Technological advances have made the site seem antiquated
- The site isn’t optimized for mobile or social media
- The information architecture of the site is a mess and many links are broken
- The user experience is confusing and there is no unified structure
- Analytics show users have trouble doing what they need and don’t stick around
While the first two reasons on the list may simply require a visual refresh, the others involve important UX changes.
You may be tasked with conducting a redesign following a UX audit . However, sometimes a client or stakeholder will request a complete UX redesign simply because they look at their product’s user interface all day and are bored. This can lead a client to focus on the things they don’t like about their product’s user experience. On the other hand, users probably feel differently. Users are creatures of habit. And since they’re spending far less time with a product’s user interface than the client, they’ll typically see the familiarity of the UI as a positive.
Consider this: If Amazon.com completely overhauled its website in order to make the website seem more innovative or interesting, but in the process changed how to find items, how to add them to your shopping cart, and how to check-out, what would be your response? If you’re like most people, you’d be frustrated. You already know how to complete tasks successfully on Amazon. Anything outside of an incremental change will make that more challenging and time-consuming. No matter how cool the newly implemented changes may seem, most users won’t be impressed. Their goal when they go to your website, app, or other UI is to complete their task and meet their goals in as little time as possible.
So if a client or stakeholder wants to completely rehaul a product’s user experience but they don’t have a good reason for doing so, you as the UX designer must make sure to advocate for the product’s users. This could mean discussing other options, like a visual refresh or small UX changes with your client.
One way or another, it’s essential to make sure any changes you make, even on a complete overhaul, are not made for the novelty of the changes. It can be tempting to be as creative as possible. However, you’re better off understanding what users are already familiar with from the product (based on their mental models ) and implementing changes that respect what your users like while mixing in some new but understandable evolutions.
Unsolicited redesigns
If you’re a fresh-faced UX designer just starting out, you might also conduct a hypothetical—or unsolicited—redesign. This is a great way to put your newly acquired design skills into practice, and also gives you a case study to add to your portfolio in the absence of a real client project.
An unsolicited redesign is, quite simply, a hypothetical project of your choice . Perhaps there’s a particular website you use regularly that you think could benefit from an overhaul, or a certain app that could be upgraded with a few simple tweaks. Just like a “real” client project, you’ll redesign the experience and document your process from start to finish in your portfolio—just like Priyanka Gupta does in her unsolicited redesign of the Sephora iOS app . Just remember to clearly state that you’re not affiliated with the company in any way, and that you haven’t actually been hired to conduct a redesign. Otherwise, the process is the same as for a real UX redesign. Let’s take a look at that now.
3. How to conduct a UX redesign: Step-by-step
1. understand existing users.
In an ideal world, all UX redesigns would start with user research and analytics. Analytics for an existing product will help you understand how users are currently using the product, and identify the biggest pain points they encounter based on how long they use the product and how many screens they visit. This also gives you hard data that will help you make specific recommendations for where to focus the efforts of your redesign.
Whether you have access to analytics or not, you should perform user research on the product you are redesigning. As Nielsen Norman’s Hoa Loranger explains, “Your old site is the best prototype for your new site.” Make sure you take advantage of that by learning from the existing product. Gather user feedback on what they dislike about it, while also making sure to ask about what users like about the current product. All of this information will help fuel your redesign.
2. Understand business goals
It’s essential to understand what the business wants to get out of the redesign. What do they know about their existing users that can help you conduct your redesign? The UX redesign solution should be specific to the business’ goals while keeping user needs in mind. If the business wants to make it easier to navigate to specific information, increase page views, or complete more sales, the user experience must be designed to support those goals by making it easier and more beneficial for users to do those things.
3. Competitive analysis
Another source of information for a redesign: analyze competitors’ products . Take a look at competitor’s UIs to see what they’re doing that’s different. What works? What doesn’t work? Are there innovative solutions that you can borrow that will better engage your users? Are there things they’re doing that you want to avoid?
In addition to researching users’ reactions to the product you’re redesigning, you can also perform a study to see how users respond to competitors’ products. Explore how users interact with the interface and navigate through the user experience, including what they find clear and easy to use and where their pain points are.
4. Redesign
After gathering data from the existing product and competitors and ensuring you understand the business goals for the project, you should be ready to start redesigning in earnest. You’ll often want to start with a site map of the redesigned information architecture. You’ll also want to make sure you understand the various ways users may work through the site to meet different goals by creating user workflows. Once you have a handle on these top level issues, you can start wireframing and creating prototypes for the redesign. Ideate on potential user experience options until you come up with a solution that works best for both the business and users.
5. User testing
Finally, test your redesign with users, preferably users of the previous iteration of the product. Get feedback on what they like about the new design and what may frustrate them. Keep in mind that any redesign is likely to ruffle some users’ feathers. But user testing will help determine if there are any real usability problems with the redesign. If there are, continue to iterate on the redesign until the user experience is working the way it should.
4. Showcasing redesigns in your UX portfolio
While it’s not essential, it is valuable to include at least one redesign project in your UX portfolio. To most successfully showcase a redesign, make sure you can explain why the redesign was done, what your solutions were to the challenges presented by the client, and why you decided to implement any noteworthy features. Showcase the redesign process in the order it was conducted—from studies on the previous and competitors’ sites, right through to user workflows and information architecture overhauls to page-level redesigns—in order to tell the story of the redesign. You don’t have to include everything, just enough to make sure the process you went through is clearly represented. Your goal should be to clearly communicate to someone looking at your portfolio how you improved on an existing product with your redesign and the journey you took to get there.
5. Key takeaways
Now you have a clear process to follow in order to conduct a UX redesign—be it a real client project, or an unsolicited redesign for your UX portfolio. To sum up:
- Redesigns can run the gamut from a visual refresh to a complete user experience overhaul.
- The most important question to ask before starting a redesign is why the client or stakeholder wants to conduct it.
- There are many reasons to conduct a UX redesign including a product that is no longer optimized for new technology, convoluted information architecture and a confusing user experience.
- The kind of redesign that is undertaken should be based on user needs, not boredom on the part of clients or stakeholders who work with the user interface regularly.
- A good UX redesign starts with studying the existing UI, as it is the best prototype for your new product.
- Make sure you understand your clients’ business goals and how they can be seamlessly integrated into the redesigned user experience.
- Research competitors’ products to see what works and doesn’t work about their UX.
- A UX redesign should consist of a variety of deliverables including user workflows, site maps of the information architecture, wireframes, and prototypes . Iterate on the new design and perform user testing until the user experience is working as it should.
- It’s ideal to include at least one redesign in your UX portfolio that tells the story of the challenges of the project.
Now that you know how to approach a UX redesign, you might want to learn more. If so, you’ll find the following articles useful:
- 9 Awesome UX Portfolios From UX Design Graduates
- What is a Wireframe? A Comprehensive Guide
- The 5 big differences between UX and UI design
11 Inspiring UX Case Studies That Every Designer Should Study

A UX case study is a sort of detailed overview of a designer's work. They are often part of a UX designer's portfolio and showcase the designer's skill in managing tasks and problems. From a recruiter's perspective, such a UX portfolio shows the skill, insights, knowledge, and talent of the designer.
Therefore, UX case studies play an important role in the recruitment and demand for designers.
What Makes a Powerful Case Study
Building a UX case study includes showing the design process through compelling stories. They will use plain language to demonstrate how they handled key design issues, offering a comprehensive view of their process. Well done case studies often include:
- A problem statement and solutions with real applications.
- Relevant numbers, data, or testimonials to demonstrate the work and efforts.
- A story that directly connects the problem to the solution.
Any competent UX professional will know that creating a stunning UX case study is about the little details.
11 Best UX Case Studies for Designers
The best way to understand what a good case study looks like is to go over other examples. Each of these UX case study examples shows a designer's insights, basic skills, and other designers' lessons learned through their experience.
1. Promo.com web editor

For this video-creation platform , UX designer Sascha was brought on to revamp v2.0, adding new features that could work alongside the existing UX design. The point was to work on interface details that would help create a user friendly platform, and that users could find simple enough to use.
User personas mapped by the UX designer revealed the most common confusion to be the process of inserting particular features into the video, such as subtitles. The designer's goal, therefore, was to create a platform with improved editor controls.
The designer then used a common text-editor layout to include top and side navigation bars that made it easy to access and implement text editing.
Key Learnings from Promo.com
This case study focuses on addressing a particular problem that customers were currently facing. Its main theme is to show a problem, and how the product designer addressed this problem. Its strength points include:
- clearly highlighting the problem (i.e. inaccessible and limited video-text editor options)
- conduction research to understand the nature of the problem and the kind of solutions customers want
- implementing research insights into the redesign to create a platform that actively served customer needs
2. Productivity tracker app
The main concept behind this UX case study is to address a pre-existing problem through the design of the app. Immediately from the start, the study highlights a common pain point among users: that of a lack of productivity due to device usage.
This UX case study example addressed some of the main problems within existing productivity apps included:a poor UI and UX that made navigation difficult
- a poorly-built information architecture
- limited functions on the mobile application
Key Learnings from the Productivity app case study
The case study highlights the simple design process that was then used to build the app. Wireframes were created, a moldboard developed, and finally, individual pages of the app were designed in line with the initial goals.
3. Postmates Unlimited

This case study clearly identifies the improvements made to the Postmates app in a simple overview before jumping into greater detail. The redesign goal, which it achieved, was to improve the experience and other interface details of the app.
The problems identified included:
- usability that led to high support ticket volume.
- technical app infrastructure issues that prevented scalability.
- lack of efficient product management, such as batching orders.
A UX research course can help understand the kind of research needed for a case study. The app redesign involved bringing couriers in and running usability testing on improvements. The final model, therefore, had input from real users on what worked and what caused issues.
Key Learnings from Postmates
The Postmates redesign works as a great UX case study for the simple way it approaches problem-solving. Following an overview of the work, it addresses the problems faced by users of the app. It then establishes research processes and highlights how changes were made to reduce these issues.
4. TV Guide

Addressing the fragmentation of content across channels, this case study sought to redesign how people consume media. The key problems identified included:
- the overabundance of content across various TV and streaming platforms
- the difficulty in discovering and managing content across all platforms
To deliver on the key goals of content personalization, smart recommendations, and offering cross-platform content search, the design process included conducting interviews, surveys, and checking customer reviews.
The design of TV Guide enables users to get custom recommendations sourced from friends' and family's watchlists.
Key Learnings from TV Guide
Like previous UX design case studies, this one tackled the issue head-on. Describing the research process, it goes into detail regarding the approach used by the UX designers to create the app. It takes readers on a journey, from identifying pain points, to testing solutions, and implementing the final version.
5. The FlexBox Inspector

Designer Victoria discusses how she developed the investigator tool for the Mozilla Firefox browser. Surveys into understanding the problems with the existing CSS Flexbox tool revealed a need for a user-friendly design. Interviews with a senior designer and other designers helped developers understand the features design-focused tools ought to have. A feature analysis revealed what most users look for in such tools.
The final result of the development process was a design that incorporated several new features, including:
- a new layout
- color-coded design
- multiple entry points to make workflow management efficient
Key Learnings from the Flexbox
This UX design case study starts with a clear goal, then addresses multiple user needs. It clearly defines the design process behind each feature developed by the time, and the reasoning for including that feature. To give a complete picture, it also discusses why certain features or processes were excluded.
6. The Current State of Checkouts

This Baymard UX design case study looks into the checkout process in over 70 e-commerce websites. Through competitive analysis, it isolates problem points in the UX design, which, if addressed, could improve the customer's checkout process.
The study found at least 31 common issues that were easily preventable. The study was designed and conducted on a large scale, over 12 years, to incorporate changing design patterns into the review.
Recommendations based on findings include:
- prominent guest checkout option
- simple password requirements
- specific delivery period
- price comparison tool for shipping vs store pickup
Key Learnings from Checkout Case Study
Each identified issue is backed up by data and research to highlight its importance. Further research backs up each recommendation made within the case study, with usability testing to support the idea. As far as UX case studies go, this one provides practical insight into an existing, widely used e-commerce feature, and offers practical solutions.
7. New York Times App

Using a creative illustration website, the designers proposed a landing page feature "Timely" that could counter the problems faced by the NYT app . Its major issues included too much irrelevant content, low usage, and undesirable coverage of content.
The goal behind Timely was to improve user incentives, build long-term loyalty, and encourage reading. Design mapping for the app covered:
- identifying the problem
- understanding audience needs
- creating wireframes
- designing and prototyping
The end result was an app that could help readers get notifications regarding news of interest at convenient moments (at breakfast, before bed). This encouraged interaction and improved readability with short-form articles.
Key Learnings from NYT App
The UX case study proposes a problem solution that works with an existing information architecture, instead adding custom graphics to the mobile app. It leads from a simple problem statement to discuss the project that could address these issues without changing was customers already loved.

UX case studies focused on redesign include the FitBit redesign, which started off by understanding personas and what users expect from a fitness tracker. Developing use cases and personas, Guerilla usability testing was employed to assess pain points.
These pain points were then ranked based on their importance to users and to app performance. They were addressed through:
- Highlighting essential parts and features of the app
- Changing easily missed icons to more recognizable icons
- relabelling tracking options to guide users better to its usage
Key Learnings from Fitbit
While the case study maps user experiences and offers solutions, it does not begin with an intensive research-based approach. The prototype is successful in testing, but problem factors are not identified with research-based statistics, meaning key factors could have been ignored.
9. Rating System UX

The designer behind the rating system UX redesign sought to solve issues with the 5-star rating system. Highlighted issues included:
- the lack of subjective accuracy of a 5-point rating system
- the issue of calculating the average of a zero-star rating
- average ratings are misleading
Better alternatives include:
- 5-star emoticon rating that relates the user experience
- Like/dislike buttons that make approval/disapproval simple
The final design incorporated both these styles to make full use of the rating system.
Key Learnings from Rating System UX
The UX case study stemmed from insight into the limitations of the existing rating system. The new design addressed old issues and incorporated better efficiencies.

The Intuit redesign was focused on making content readable, more engaging, and accessible. Looking into product personalization, the content was found to be lacking aesthetic value, as well as being hard to find. The goal was to create content that was easy to find, clear, and consistent.
The implemented solutions included:
- increased readability with increased body text and header spacing
- table of contents on the sidebar for easier navigation
- visible and prominent search bar
- illustrations and designs for pretty visuals
Key Learnings from Intuit
The Intuit case study approaches the problem from a practical point of view. It begins with isolating problems with the interface, in particular with the content. This is an example of a case study that breaks down problems into broader categories, and solves each problem with a practical solution.

This UX case study about a social platform tackles a commonly-faced problem from existing platforms. It addresses the issue of recognizing non-monetary user engagement, to help creators identify their user base.
The case study addresses the problem statement and establishes the design process (building wireframes and prototypes) as well as conducting user testing. The final result is to develop "Discover" pages, engaging layouts, and animated interactions to increase usability.
Key Learnings from Jambb
The study goes into detail regarding problem identification, then moves on to propose solutions that take into account the perspective of all stakeholders involved. It then explains why each design decision was made, and proves its efficacy through testing and prototyping.
Key Takeaways
Developing good UX case studies examples is as much about the details you include as the ones you leave out. Going over UX courses can give you a better understanding of what your case study should look like. A good case study should provide an overview of the problem, include numbers and statistics, and offer practical solutions that directly address the problem. The above-discussed UX case studies provide a good example of the dos and don'ts of a well-structured UX design case study that should be part of every UX portfolio .
Additional Resources
Check out these resources to learn more about UX case studies:
8 UX Case Studies to Read
UX Design Case Study
Frequently Asked Questions
Upskill your design team effectively.
Equip your design team with the best-in-class design training that sticks.
Do you know your design team skill level? Send them this quick test & see where their skills stand among 300K+ designers worldwide.
Level up your design career
Get step-by-step guide how to build or advance your UX design career.
Do you know your design skills level? Take a quick test & see where you stand among 300K+ designers worldwide.
Continue reading
The impact of ux design on application success: exploring costs and trends, 7 top ux careers & specialisations: skills, paths & opportunities, 15 figma plugins to boost your design workflow, cookie settings 🍪.
- Interactive UX learning for all levels
- 20+ UX courses and career paths
- Personalized learning & practice
Design-first companies are training their design teams. Are you?
- Measure & identify team skill gaps
- Tailor learning for your team’s needs
- Unlock extensive learning library
- Visualize team growth over time
- Retain your designers
- Business Strategy
- Product Design
All you need to know about app redesign: a step-by-step case study

So you’re thinking about redesigning your app. There’s nothing unusual about that – most product owners opt for a radical makeover sooner or later. After all, redesign is the best way to adapt to the market’s evolving standards .
Are you wondering what this process looks like up close? We’ve prepared a step-by-step guide together with a redesign case study to satisfy your curiosity. Keep reading to find out:
- What redesign is ;
- Which famous brands have successfully undergone this process;
- How your business can benefit from redesign ;
- In what cases it is wise to turn to it;
- How to redesign an app step by step – Miquido’s case study .
Let’s jump right in!
What is redesign?
Redesign refers to the changes made to visual identification or architecture of a product. The goal is to make it more updated, functional, and in-line with the most recent design trends . In some cases, redesign is a part of a rebranding strategy that aims to modify a brand’s image in general. However, you can also redesign particular elements of the product or the brand’s visual identity, such as logo, app design, etc., separately.
UI vs UX in redesign
Sometimes, it’s all about the looks. In these cases, designers usually try to implement new trends in the project without compromising the brand’s voice and unique character.
There’s also a chance that it’s the app’s architecture and the overall flow that require some lifting. Just as for User Interface, people’s preferences for user experience are shaped by the dominant trends in the industry. When other apps introduce solutions that improve performance and intuitiveness, users get used to them very quickly.
That’s why redesign can be essential for brands that want to grow fast – it allows for keeping up with the clients’ evolving needs and habits and stops them from migrating to other products.
The most efficient way to approach redesign would usually be to work on user interface and user experience simultaneously . However, this is not always the case. And if you’re not sure whether your product needs help with the visuals or if it’s the entire customer journey that you’d like to modernise – reach out to professionals for a quick free consultation.
Want to discover the main differences between UX and UI design ? Check our detailed comparison!
Successful examples of redesign campaigns
Surely, you know at least a couple of global brands that have changed over the years. The Internet is full of such examples. Globally known apps go through a subtle facelift aiming at improving the user experience rather often. However, let’s focus on frequently discussed examples.
Instagram’s most memorable redesign dates back to 2016, when the brand introduced a new logo. It still represents a camera but in a much simpler form. Instagram has also simplified its interface by removing the colorful background. This way, it became even easier to focus on the content . The trend of minimalism is still prospering on the market today.

G-suite, during its latest redesign, has turned into Google Workspace . The Google team has introduced UX/UI improvement, making the apps seem lighter and more approachable by increasing white space. The most commented part of the redesign was, undoubtedly, the change of the icons. This change has caused mixed reactions – some existing users consider the new design confusing (check this analysis by TechCrunch for more info).
Uber is a real record-holder when it comes to rebranding. Over one decade, the brand has changed its logo five times ! The last version signifies a new chapter in Uber’s history, cutting it off from all the recent scandals. A particularly important change has touched the app’s UX, which now offers integrated access to Uber Drive and Uber Eats and saves users’ time and device memory.
The examples don’t end here, for there are many more other companies successfully benefiting from their rebranding efforts. However, we must move on to a much more pressing issue: what’s in it for you and your business?
How do you know when it’s time to redesign your app?
When working on their product designs, some brands put a strong emphasis on timelessness. We can risk saying that this word doesn’t really exist in UX designer vocabularies. Every design has an expiration date . There are, however, certain things that stay true with time. One of them being some obvious advantages a good redesign strategy can bring.
Unquestionable benefits of redesign for business owners
If all the signs suggest that it’s time to refresh your logo or application – it probably is. The market is subject to constant transformation – design canons evolve, users change their aesthetic preferences, expectations, needs, and habits.
Here are some of the basic benefits of redesigning your business you cannot overlook while building your digital product strategy :
Does this mean you should jump into the redesign process headfirst even if your business seems to be doing just fine? Of course not! Remember, the first rule of a good design is:
It’s not how it looks or feels. It’s how it works.
And, in order to make the right decision, you first need to understand whether everything is working the way you intended it to.
Signs you should redesign your app ASAP
There are some specific red flags that indicate you should consider redesigning. We’ve gathered the most common ones:
Negative feedback

Don’t be afraid of checking what people have to say about your brand. If you keep receiving bad reviews, something is definitely up. Looking through user feedback gives you a bigger picture of the existing problems and helps create the right solutions.
Poor conversion rate
The fact that users are not converting on a specified goal may originate in the complicated interface or architecture that does not match their needs. Improving UI & UX can lift the conversion rate and translate into profit.

Ongoing rebranding

Changing the visual identity of a brand and its tone of voice enforces the evolution of your product. Otherwise, there might be some inconsistencies in its image.
Expansion prospects
To keep ahead of the competition, you should make sure that both the UX & UI of your app is refined in every detail. This way, penetrating a new market will be easier and the overall impact of your product will be more significant.

Ok, but how should you approach the redesign process to end up with the most satisfying results ? We thought we’d spare you a Wiki-how approach and instead provide our very own case study. This way, you’ll know which parts of the process matter the most in real life and what you can hope to achieve.
A transportation app redesign case study: Miquido perspective

As the subject of this case study, we’ve chosen a popular transportation app that enables mobile payments for public transport and parking. However, it’s not about the brand names – it’s about the process, so we’ll be keeping things neutral. Our research is focused on universal aspects of the process , explaining how they contribute to the final effect.
And remember – you don’t have to go through the whole redesign process alone! Leave it to us – Miquido design team will be more than happy to navigate you through the whole redesign journey without any setbacks.
It can all be reduced to 5 simple steps , and we’re going to cover them one by one:

Step 1: Listen to the world around you
First of all, in order to provide a useful product, you’ll have to be aware of the latest updates in your industry and the most contemporary solutions that exist on the market. This will require some deep research on your end, including, yet not limited to, regular monitoring of Google Trends and the latest news regarding your industry.
When it comes to public transportation, we’ve established the following as the dominating tendencies:
- The increased popularity of digital tickets : they’re considered to be more convenient, but also better for the environment.
- Growing demand for third-party apps supporting ticket purchase : according to the research from 2020 , users tend to use apps that support buying the tickets, as they make the process faster and easier.
- Popularisation of QR codes : according to a GSMA report , payments with QR codes are becoming increasingly common.
Step 2: Carry out a competition analysis
Compare the solutions implemented by your competitors and verify how the users interact. There are various online tools you can use for this purpose, like SEMRush or BuzzSumo . By using them, you can gather user insights and see which ideas work and what draws people away. Add your own twist to the proven solutions or try to come up with some innovations that none of your competitors has considered so far.
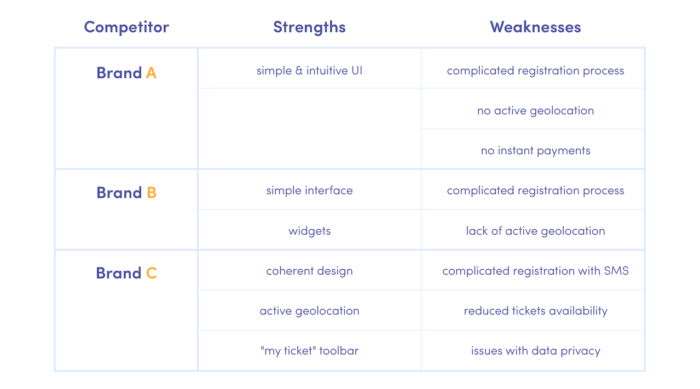
In the case of our transportation app, conducting a SWOT analysis led us to the following conclusions:
Step 3: Empathise with your target audience
After getting familiar with the general situation on the market through a research and competition analysis, it’s time for defining user problems & challenges within the particular app .
As we specified earlier – user opinions matter. So now it’s time for you to understand what will make them happy and how to do it in the most efficient way possible. Draw empathy and customer journey maps, organise focus groups, interviews and surveys, browse through Quora, Reddit, and other ready-made sources of priceless information on what kind of a solution people are actually looking for. It will make your job to satisfy them much easier in the end.
Following from our analysis for the transportation app redesign, the most common issues users face include:
- A confusing purchase process : including issues like the lack of instant payments, multi-step buying process, unintuitive app navigation.
- Problematic data privacy: there’s a general discontent with applications that request broad access to user personal data without explaining the purposes.
- Exclusion of non-locals : transportation apps are usually designed by locals for locals, so naturally they tend to overlook the needs of everyone else. This means that such apps lose a large group of potential users by discouraging tourists and expats from using them.
Step 4: Understand how your solution can help
Now that you know exactly what the industry has to offer, how your competition is operating, and what your users are looking for, it’s time to provide them with a solution that will address their needs in the most efficient and modern way possible.
For our transportation app, we established the following ideas for improvement:
- Registration: cutting the whole registration process down to two steps in order to keep people engaged by making it less bothersome.
- Payments: simplifying the experience by introducing instant payments with PayPal, Apple Pay, or GPay; replacing the timer with a progress bar.
- Data privacy: including explanations on data usage and making sure the app only requests it when necessary.
Step 5: Test like there is no tomorrow
Releasing a final product without passing through a testing phase is risky and may result in financial losses. This stage of digital product design (and redesign) is perfect for eliminating bugs and rejecting the solutions that don’t really work . Some ideas only look good on paper! So test, test, and when everything seems to be ready – test some more, just to be sure.
Quick wins for an even better redesign campaign
As you can see, a lot can be achieved with the right team, the proper technology solution , and some determination. The example above should have given you an idea of what the redesign process can look like.
Sometimes the smallest improvements make the biggest difference. So here are some fool-proof ideas you could implement in no time and with little effort:
- Simplifying the interface : let some white space in and make it easier for the user to focus on the content.
- Introducing a dark mode : this is a perfect solution for those who often use public transport in the late hours or travel underground.
- Active geolocation : this tiny addition to your existing functionality helps to avoid the mistake of buying a ticket in the wrong place and provides users with a greater sense of safety.
Go ahead and test it yourself! Or, if you’re looking for qualified support with redesigning your product , reach out to our UX agency !
What is the cost of app redesign?
The cost of redesigning an app in 2023 could range from $5,000 to as much as $50,000. The price will depend on the complexity of the redesign but also the size of the team, the location of the company, or the technology chosen. Considering that a good app redesign can increase our revenue several times over, this investment does not seem like such a high cost. As you can see, user experience is one of the essential aspects of the application development process.
How long does it take to redesign an app?
The redesign time of an application depends on how much needs to be changed. If the app has few features and is not very advanced, a redesign can take 1-2 months. The more features, the more the redesign time increases, amounting to as much as 6-9 months for larger apps. It is, therefore, a highly individual matter, and much depends on the change that needs to be made. Sometimes, in redesigning an application, a few changes can make a significant difference, and sometimes the entire application’s design must be created from scratch.
When should I redesign my app?
Factors such as negative feedback, poor customer retention rate, spatial design, and poor conversion rate are clear signs that it is time for an app redesign. Unfortunately, a negative user experience can strongly affect the success of an app, which is why, in addition to redesigning the app, it is always worth ensuring a good First Time User Experience . However, there are also several other external factors. One of these is a change in the software manufacturer’s application-related guidelines. This often occurs when the system version is upgraded to a newer version. Also, redesign may be necessary if the application is transferred to devices with a different operating system. Another aspect that is a factor for redesign may be the rebranding of the company. Some experts also believe that every application should undergo a redesign once every 2-3 years in order to adapt to the latest trends.
- Product strategy
- UX/UI design
Your data is processed by Miquido sp. z o.o. sp.k. with its registered office in Kraków at Zabłocie 43A, 30 - 701 Kraków. The basis for processing your data is your consent and the legitimate interest of Miquido. You may withdraw your consent at any time by contacting us at [email protected] . You have the right to object, the right to access your data, the right to request rectification, deletion or restriction of data processing. For detailed information on the processing of your personal data, please see Privacy Policy . Show more
Related posts

5 reasons why you need a digital product strategy

Design thinking in business strategy: get more with less

The ultimate guide to UX Design
Subscribe to stay in the loop!
Redesign: adding case studies to your ux portfolio.

Prefer to read in Ebook format?
We will send you this complete Ebook to facilitate your reading.

When someone posts about a logo redesign (or any other digital product), it usually draws a lot of attention. Of course, everyone is entitled to an opinion once it is public on social media. But most people commenting on those…
Sending the ebook
You will receive the ebook directly in your email a few minutes after confirming your request in the form below.
Ebook sending confirmed!
You will receive the ebook directly to your email in a few minutes.
Attention! Please check your spam folder if you cannot find the email in your main box .
Once you find the email in spam, move it to your main box and add the email [email protected] to your contact list, thus preventing other emails from the spam folder.
When someone posts about a logo redesign (or any other digital product), it usually draws a lot of attention. Of course, everyone is entitled to an opinion once it is public on social media.
But most people commenting on those posts don't have the necessary experience or knowledge to criticize the work on technical grounds. And most importantly, it doesn't show the process!
Yes, you can always use these posts to test how people react to your designs, but this is not the best way to go if you need to study the design processes within UX and UI or gather recruiters' attention.
I f you wish to learn and practice , the most important thing ( for you and for recruiters ) is not the final result but how you achieved that outcome . What led you to each design decision? How was your design process?
A throughout redesign project should show all of the steps a designer took to reach that final result; it doesn't matter if it was a website redesign, a logo, or an app.
What we will discuss in this article is how you can use a redesign to practice and enhance your studies and build your UX/UI Design portfolio ! Learn how to give real meaning to this process because it can really help your career.
Redesigning as a learning opportunity
Product Design is a practical discipline. Although it is important to understand its concepts and various tools, it's only by practicing that you can really learn the deed.
Therefore, redesign is a great way to put into practice the skills you want to improve, especially if you are studying alone or taking an online course.
Furthermore, with a redesign process, you can elaborate UX/UI Design projects to compose your portfolio.
Reading tip: Redesign: Are You Sure About It?
Can I use case studies in my portfolio?

Designers starting out or moving into UX Design may have this question: if I'm just starting out, how do I compose a portfolio?
The answer to this question would be: yes, it is possible to use study projects, including redesigns, to compose your portfolio. In fact, this is the best way to start your portfolio. But be careful and know, above all, how to present your project.
It is not enough just to put the end result of your project/study/redesign in the portfolio. It is important to make clear the whole process, premises, data, and reasoning used to design the final result.
Remember that there are tools that can help you when putting together a portfolio, such as storytelling.
Other tools can help you build the argumentation and reasoning to effect the redesign. The User Journey is one of them.
In summary, it is important to give as much context as possible in the presentation of the work, because the UX Designer's reasoning and process is so fundamental that without it the final result is nothing but meaningless screens.
This is one of the reasons why designers should not ask for feedback openly on social networks, because it is impossible to give the proper context for the reviewer to comment in a way that adds real value, and the comments are only around praise or shallow criticism.
Reading tip: User Journey Map: Understanding and Improving Interactions
Example of students who have used case studies in their portfolios
Many of our students have pivoted to UX Design from totally different areas. In this sense, they did not have a portfolio in this area.
Since Aela's Bootcamp have a strong practical focus, our students can use the course projects and exercises to build their portfolios.
" I had a job interview and was able to put together a portfolio overnight by putting together 3 pieces plus a complete case, using the MID exercises. I presented the portfolio and passed the process. " – Joyce Almazan

"[. ..]during the Bootcamp I was building my portfolio through the UX, UI, and redesign projects and the meticulous guidance of Aela's mentors and the help of the Aela Community on Slack. So, everything I was doing, I used as a resource to compose my portfolio and present it in the interviews. " – Fábia Coelho

Reading tip: Nielsen’s Heuristics: 10 Usability Principles To Improve UI Design
How should I structure a redesign project?
We have assembled 3 main steps to follow if you want to embark on a redesign project to enhance your studies or to build your portfolio:

1) Identify the problem
To begin a redesign, you must first be clear about the problem you want to solve. Remember that the purpose of the redesign is not to change a product's aesthetics, as this won't add value to your UX portfolio. Instead, a new design must solve a gap or contemplate an opportunity for improvement.
So, identifying the problem is the first step (and the most essential) when proposing solutions.
Here is a golden tip: the problem you're trying to solve should be told in a way that engages the audience .
This way, your audience (think of recruiters) can empathize with users' struggles so that when you present your solution, it adds depth and more meaning to it. Remember that storytelling is a powerful tool to trigger emotions in your audience and can definitely help you during job interviews.
2) Complete redesign or incremental changes?
After identifying the problem, evaluate which is more efficient: a total redesign or incremental changes.
In real life, designers will not work on all problems of a product at once, as even a simple bug can take months to solve.
With this in mind, we suggest selecting just one core issue and delivering a deeper, more detailed solution or selecting a few problems and working on them without so much depth, but that, once combined, adds value to the product.
3) Know your limits but be creative
A real redesign case requires a lot of studies, research, user testing, and alignment with company goals.
You probably won't have this level of detail, research, and data within a case study. However, seek out information and conduct research that is within your reach.
Check out, for example, what some of our MID students have already done to gather information for their own projects:
- Israel Mesquita contacted and conducted a Skype interview with the top content writer for Wikipedia;
- Jânio Rodrigues went to a university and personally surveyed some students to build personas;
- Daiane Thomé got the contacts and sent messages to health professionals to understand more about her clients' profiles;
- Manuella Moura searched the "Reclame Aqui" website for the most common complaints about Nespresso's technical assistance to understand the problems users usually encountered;
- Ana Carolina Toledo applied online forms to get more detailed information about Wikipedia's issues.
Final considerations
There are many other ways to find the information you need to apply to your redesign. Be creative! But don't forget the limitations of a portfolio redesign.
In real projects, crucial information is within your reach, such as the company's goals, which is impossible to get for a case study.
Think carefully about which assumptions you will adopt, and do your best to explain each step and why you made each decision in your redesign project.
It is precisely this reasoning that companies and recruiters want to see in your portfolio to decide if you will be a good fit for the position they are looking to fill.
Remember to be humble when analyzing and proposing a product redesign; a team of designers is probably working avidly to ensure their users are happy. So don't underestimate the teams that developed the design that is under your study.
Redesigning is good practice for sharpening your skills and is a project that can be included in your portfolio. But remember: it has more to do with usability than aesthetics.
Don't forget to like and share if you enjoyed this content! This small gesture helps us a lot! Feel free to continue browsing, and if you'd like to stay up-to-date, sign up for our newsletter !

Fascinating Fusion: The Daring Dance of UX and Graphic Design

Jargon In UX Design: Unlock A Killer Vocabulary Now

UX Design in 2024: Your Career’s Revolution Starts Now

Career in Product Design: How to Set Goals that Work

Empower and Transform: The Astonishing Impact of User-Centered Design

Transform Your Product Design: The Powerful Impact of Expert Feedback
We are proud to have people from our community hired every month by great companies, in countries such as Brazil, USA, UK, Ireland, Germany, Netherlands, Spain, Portugal, Austria, Czech Rep., New Zealand, and Canada.
Privacy Overview
The Challenges of Application Redesign and Case Study
App Redesign , Digital Application Redesign , Digital Product

Digital Application Redesign
Remember the first time you heard “there’s an app for that”? Chances are, it was longer ago than you realize. The Apple ad campaign tagline was copyrighted in 2010 and had been used for at least a year before that as the Cupertino tech giants began revolutionizing the cellphone industry. The idea of the “app” as a cultural phenomenon is nothing new — it’s not even from the last decade.
What are we getting at here, exactly? Well, in this age of digital transformation, it’s easy to get distracted by ticking boxes and going through the motions. Yes, modern businesses need branded apps and tailor-made software products, but this is not the ‘endgame.’ Instead, companies need to constantly reappraise, redesign, refresh, and revamp their applications, ensuring that these pieces of software are still suitable for their ultra-competitive landscape. Just deploying an app is not enough — you need to ensure your applications go above and beyond for your users, delivering the kind of UX they could only dream of a few years ago.
Redesigning and improving existing apps are vital steps as you make sure your software is fit for your specific purposes. But app redesign process steps pose a lot of challenges especially for unique cases like a mobile app redesign project. In this article, we’ll explore some of these challenges and look at how to execute your redesign.
What Is Digital Product Redesign?
Digital product design services usually involve either an entire overhaul or a refresh of an existing digital product. You already have an application that is serving your clients, customers, or internal business users, and you do not necessarily need to go back to the drawing board and come up with something entirely new. Instead, you can opt for an interface redesign, add extra features, or re-organize and refresh the app content and functionality to meet your users’ growing demands.
While the product redesign definition is simple, the project itself can take several forms. For example, you may want to bring brand consistency to a suite of apps that have become outdated, providing a common user interface and aesthetic palette between each one.
NFT App Redesign for The Grid by Fuselab Creative
Product Redesign Examples: App Redesign UX/UI Case Study 1
Google famously did this with their UX redesign project for their G-Suite apps , achieving better consistency between separate offerings like Gmail, Docs, and Drive, among others. This web application redesign changed the minds of a lot of users. The team behind G-Suite identified that clients were using these individual products together as a unified whole, essentially achieving a full office and productivity suite from Google — yet the applications looked and behaved like different products. Bringing the apps together under a more consistent brand umbrella reinforced the idea that Google could provide a complete set of solutions to outperform competitors such as Microsoft Office.
Alternatively, you may wish to streamline the user experience of your app.
Product Redesign Examples: App Redesign UX/UI Case Study 2
One of the most popular music streaming apps around, Spotify, is consistently updating and refreshing its menus and feature layouts to target specific design problems. These updates are intended to provide a far more streamlined and intuitive flow that is also easy on the eye. Spotify provides a useful UI redesign case study, as this is among the most widely used apps in the digital landscape. Its ease-of-use interface is a crucial differentiator between Spotify and competitors such as Deezer or Amazon Music. Speaking of Amazon, it has been reported that the central Amazon shopping platform pushes new code to the site approximately every 60 seconds, to constantly improve the user experience.
App UX Redesign Challenges
Take a look at some of the key challenges most experience during a redesign of an existing digital product .
Identifying What to Change and What to Keep
Introducing this article, we touched on the idea of “ticking boxes” and “going through the motions.” An app redesign should be neither of these things. Never redesign your app just to achieve a new look or shake things up. Instead, think about specific problems or areas of friction for your users, and base your redesign project on solving these issues. If something works well, keep it — if another aspect is not pulling its weight, change it. We know, we know, this is easier said than done, believe us, we know, as a digital product design agency , we are helping others make these decisions every day. We also know that now more than ever apps with a bad UX will most likely struggle to remain competitive, as is the case with any poorly designed products.
Leveraging Device Features
Smartphones, tablets, and personal computers are highly powerful devices nowadays, with incredible features that your app can leverage. For instance, your app can use location data to refine geo-specific features or utilize the powerful camera of the modern smartphone for image and video capture.
Of course, users will need to opt-in and allow these interactions with device features, but this still gives web app design and mobile app design and developers a lot of scopes when they redesign an app. Problems can arise, however, if too many permissions are required. Users may get tired of allowing the app to access multiple features or may not even realize that such permissions are required. Both situations impact the usability of the app. This also is why strategic development of specific requirements for product redesign can be the difference in a successful or unsuccessful effort.
Retaining Brand Consistency
There are many different apps out there, and lots of these apps work wonders for their users. With this in mind, it can be tempting to copy the framework, structure, or other elements from competitor apps and utilize these within your software. However, while taking inspiration from other applications and pieces of software can be useful, you certainly don’t want to copy, as this often leads to a loss of control over your brand consistency and ultimately a muddled overall visual experience for the user.
Brand consistency must remain at the heart of the process when you encounter apps that need to be redesigned. This means more than just attaching your company logo to the software — it means delivering an experience your users will recognize as high quality and associate with your business. Not confirming brand consistency through the design process will only lead to an increased cost to redesign an application at a later date.
How Much Does it Cost to Redesign an App?
Managing costs.
As with any project, you will need to keep a close eye on costs as you start your web or mobile app redesign project. It’s almost impossible to say outright how much it will cost to employ UX/UI design services in a redesign effort. While the cost to redesign an existing app vs. the cost to design a whole new app is likely to be far lower, prices can still vary hugely. This kind of redesign project could cost anywhere between $30,000 to $130,000 or even more for larger-scale projects. Let’s take a look at some of the cost components that contribute to the price.
- The nature of the redesign — Is the project a cosmetic one, or do you need to redesign the functionality and features of the app as well? The latter will generally be more expensive.
- The proportion of useful components – how much of the original app will you be keeping, and how much must be redesigned?
- The proportion of in-house work – do you have skilled personnel who can handle some of the work, or will all the redesign work be handled by an outsourced team?
- Prioritizing certain features can help derive what needs to be part of the minimum viable product (MVP), and what are simply “nice to have” features and functions, but not actual deal-breakers.
Revamping an App at the Right Time
Choosing to revamp an app at the right time can be a significant challenge. Redesign the app too early, and you risk disruption by essentially taking a serviceable app offline during the process. Redesign too late, and you may be providing a poor experience to your users, and ultimately losing users/customers who may never choose to return.
Why Redesign A Product: Good Reasons For Product Redesign
When should you redesign your app? Take a look at some of the key reasons for digital product redesign;
- The existing design has become old-fashioned and out of date, in comparison to the competition.
- You are getting poor feedback from users regarding the UX and UI.
- You start tracking new metrics and realize your app is not performing as you’d thought, or as it once did.
- You have identified a new direction for your business and need your app to support this direction.
- You want to add a new aesthetic to your app or rebrand your digital product.
- Competitor research has identified functional areas in which your digital products are falling short.
- Your user engagement rates have begun to slump and customer acquisition has begun to slow down as well.
Basically, you need to be constantly analyzing your apps’ performance, listening to the user experience’s feedback, and checking out competitor products to identify when it is time to redesign.
Read also about enterprise app design .
How To Redesign An App UX/UI: Product Redesign Process
Once you have identified the need to redesign an application or product, how do you go about making this happen? How do you redesign a mobile app or another piece of digital software? The process you choose depends upon whether you are redesigning the UX of your app the UI or both.
High-level UX Redesign Process Steps:
Fuselab Creative UX/UI design agency has been doing this work for over ten years and has become enthralled by the challenges involved in looking at how to redesign an app’s UX, but what about the UI? The user interface involves more specific components, while the UX involves a much broader experience. The product redesign process for the app’s UI is as follows;
- Map out the current UI and the current unique design elements
- Conduct user testing and examine how your users are responding to the UI, and understand how the interface is supporting your desired actions and overall goals while using the app
- Define your targets and metrics for improvement, set benchmarks for success in revamping applications
- Map out a more streamlined, more effective UI that drives customers through to conversion and is consistently visually compelling
- Create a plan as to how to monitor and implement change for constant UI modernization, supplying a perceived value over time.
- Examine how the modernized UI performs according to your defined benchmarks and compare to previous app performance
- Repeat cycle for each significant function and content type for the app
Learn also about transportation app UI/UX design best practices .
Fuselab Creative Web And Mobile App Redesign Services
Here at Fuselab, we provide professional and innovative app redesign services for our clients.
Whether you need assistance with adding new features, tweaking your user interface, or looking for a full redesign of the product concept we’d like to be your go-to partner in the future.
It's a Simple Formula: Double Your Revenue by Designing a Better Product
Look at your phone right now, how many apps do you love? Fuselab creates digital apps that people love; see the proof in our reviews and case studies. We are here to help you generate revenue through expert digital product design and development.
Years of experience
Years in Fuselab
Marc has over 20 years of senior-level creative experience; developing countless digital products, mobile and Internet applications, marketing and outreach campaigns for numerous public and private agencies across California, Maryland, Virginia, and D.C. In 2017 Marc co-founded Fuselab Creative with the hopes of creating better user experiences online through human-centered design.
Browse more

Unlocking Leads & Sales: The Power of Real Estate UI/UX Design

From Data to Diagnosis: The Role of Healthcare Data Visualization

Stuart Weitzman School of Design 102 Meyerson Hall 210 South 34th Street Philadelphia, PA 19104
215.898.3425
Get Directions
Get the latest Weitzman news in your Inbox:
Case studies in design: open call to study projects designed in community.

Receive Weitzman Press Announcements
Case Studies in Design is a new effort to create opportunities for community and design leaders to think together about ways to catalyze transformational design, planning, and place-keeping from the ground up. The goals are to learn from ambitious projects designed in community, to share knowledge and experience through dialogue and a public library of case studies, and to train ourselves for new practices of creative, collective action. We hope to build conversation among thinkers and doers in community organizations, movements, public agencies, schools, and the architecture, landscape, planning, heritage and art fields.
Projects designed in community Case Studies in Design will support the development of 5 case studies per year, over 3 years (15 case studies prepared by 15 people in total). The aim is to study projects where design and planning helped build community power, and where community-led processes produced new forms of design agency through:
1. Deep conversation to shape the nature and time horizon of the project 2. Openness and deference to rooted leadership 3. Reciprocal (not extractive) processes, creatively designed 4. Collaboration and resource-sharing 5. New alliances to achieve leverage.
Collective writing and thinking project Case Studies in Design is coordinated by PennPraxis , a center at Weitzman School of Design at the University of Pennsylvania that is dedicated to the translation of theory into praxis (or action). Our aspiration is to bring together people from a wide geography and set of perspectives on diverse change efforts. Case study projects could range from outstanding examples of community- engaged design practice to more radical roles and results of design, planning or place-keeping. To propel this collective writing and thinking project, we are seeking applications from people who would like to research and author a case study.
We will support 5 case study writers in 2024 with a fee and expense allowance of $50,000 per author to research, write, and curate or create illustrations for a case study over a period of 8 months. Fees for community members participating in interviews, travel and other expenses will be managed by authors within the resources of the $50,000 lump sum for fee and expense. (Two people may apply to work together on a case project, sharing the fee.)
Public library and action—oriented summit PennPraxis will publish the case studies and create an online public library to disseminate them. We will organize a variety of forums from the classroom to gatherings with policymakers and funders to propagate strategies that increase community conversation and influence in the built environment. In the third year of the effort, with 15 case studies in print, we will organize a summit for community leaders, policymakers, students, practitioners, and thinkers to probe more deeply into methods and to shape lessons learned for key audiences. The aim of the summit is to create culture-shifting dialogue between disciplines, spheres of action, governments, funders and community leaders, practice and theory.
Case study method of conversation and analysis Most design “case studies” are project descriptions and images that focus on the what, not the how—the built project and perhaps its reception and performance. Designers are skilled at presenting the thesis, appearance and materials of their projects; so much so, that it can be difficult to understand whether the project outcomes and process measure up to the image for those who will live with them. The statement of the designer rarely conveys how the project was made, or the perspectives of community leaders, policymakers, scientists and other participants in the process.
Our case studies will place focus on the process—the many collaborators and contingencies—and offer insight into how communities and interdisciplinary teams have attempted to traverse the “valley of death” between ideas and implementation.
We aim to create a case study method that invites analysis and requires participants to shape their own values and strategies—active learning for would-be activist designers and community leaders interested taking on complex challenges. Similar to teaching case studies developed in policy and business schools, we are interested in supporting the creation of case studies that are intentionally open-ended presentations of a compelling situation that carries some conflict and uncertainty, with many different viewpoints included in the reporting, rather than critical essays that offer the authors’ conclusions or a how-to guide. The purpose is to cultivate the users capacity for critical analysis, bias recognition, collaboration, leadership, decision-making and action on challenging issues and projects. We believe that, done well, case research and discussion can help us develop theory from practice, and apply new theory to practice.
Applying to study and document a project Individuals (or pairs) can apply to develop a case for a fee of $50,000 by submitting the following material via this webform in a single pdf file of no more than 20MB:
1) a writing sample—past work that demonstrates capacity for narrative and analytical writing 2) CV or résumé with current contact information 3 a) 2,000 to 3,000-word description of a project that you think would make an interesting case study in community-engaged design, planning or place-keeping, and why (project images are optional) AND / OR 3 b) 500 to 2,000-word response to our outline of the intent of the case study program, including any critique that you think would make it stronger.
An applicant who does not apply with an interest in a particular project (outlined in response to 3a above) may be invited to document a project suggested by someone else. The length of your résumé is less important than your perspective on projects designed in community and capacity to enrich the knowledge base through the medium of case study writing and illistration.
Suggesting a project if you are not applying to write a case study We also welcome suggestions of exemplary projects worthy of deep analysis from colleagues in community and indigenous organizations, movements, public agencies, design and planning practices, and foundations. You can submit a project suggestion (with or without images) via this webform . Recommendations can be of any length, even just a project name and location or link. We can accept file sizes up to 20MB. Please include your contact information in case we would like to reach out to learn more.
Send any questions to [email protected] .
Timeline Applications will be reviewed as they come in until the deadline at 12pm on June 30, 2024. We aim to award all contracts by July 28, 2024, and may award some contracts for early applicants prior to that date. Authors will have 8 months to submit a completed case study (April 1, 2025), with an interim review at roughly 4 months.
Documentation
Download a PDF version of the Call for Applications
Governor Newsom Unveils Revised State Budget, Prioritizing Balanced Solutions for a Leaner, More Efficient Government
Published: May 10, 2024
The Budget Proposal — Covering Two Years — Cuts Spending, Makes Government Leaner, and Preserves Core Services Without New Taxes on Hardworking Californians
Watch Governor Newsom’s May Revise presentation here
WHAT YOU NEED TO KNOW: The Governor’s revised budget proposal closes both this year’s remaining $27.6 billion budget shortfall and next year’s projected $28.4 billion deficit while preserving many key services that Californians rely on — including education, housing, health care, and food assistance.
SACRAMENTO – Governor Gavin Newsom today released a May Revision proposal for the 2024-25 fiscal year that ensures the budget is balanced over the next two fiscal years by tightening the state’s belt and stabilizing spending following the tumultuous COVID-19 pandemic, all while preserving key ongoing investments.
Under the Governor’s proposal, the state is projected to achieve a positive operating reserve balance not only in this budget year but also in the next. This “budget year, plus one” proposal is designed to bring longer-term stability to state finances without delay and create an operating surplus in the 2025-26 budget year.
In the years leading up to this May Revision, the Newsom Administration recognized the threats of an uncertain stock market and federal tax deadline delays – setting aside $38 billion in reserves that could be utilized for shortfalls. That has put California in a strong position to maintain fiscal stability.
“Even when revenues were booming, we were preparing for possible downturns by investing in reserves and paying down debts – that’s put us in a position to close budget gaps while protecting core services that Californians depend on. Without raising taxes on Californians, we’re delivering a balanced budget over two years that continues the progress we’ve fought so hard to achieve, from getting folks off the streets to addressing the climate crisis to keeping our communities safe.” – Governor Gavin Newsom
Below are the key takeaways from Governor Newsom’s proposed budget:
A BALANCED BUDGET OVER TWO YEARS. The Governor is solving two years of budget problems in a single budget, tightening the state’s belt to get the budget back to normal after the tumultuous years of the COVID-19 pandemic. By addressing the shortfall for this budget year — and next year — the Governor is eliminating the 2024-25 deficit and eliminating a projected deficit for the 2025-26 budget year that is $27.6 billion (after taking an early budget action) and $28.4 billion respectively.
CUTTING SPENDING, MAKING GOVERNMENT LEANER. Governor Newsom’s revised balanced state budget cuts one-time spending by $19.1 billion and ongoing spending by $13.7 billion through 2025-26. This includes a nearly 8% cut to state operations and a targeted elimination of 10,000 unfilled state positions, improving government efficiency and reducing non-essential spending — without raising taxes on individuals or proposing state worker furloughs. The budget makes California government more efficient, leaner, and modern — saving costs by streamlining procurement, cutting bureaucratic red tape, and reducing redundancies.
PRESERVING CORE SERVICES & SAFETY NETS. The budget maintains service levels for key housing, food, health care, and other assistance programs that Californians rely on while addressing the deficit by pausing the expansion of certain programs and decreasing numerous recent one-time and ongoing investments.
NO NEW TAXES & MORE RAINY DAY SAVINGS. Governor Newsom is balancing the budget by getting state spending under control — cutting costs, not proposing new taxes on hardworking Californians and small businesses — and reducing the reliance on the state’s “Rainy Day” reserves this year.
HOW WE GOT HERE: California’s budget shortfall is rooted in two separate but related developments over the past two years.
- First, the state’s revenue, heavily reliant on personal income taxes including capital gains, surged in 2021 due to a robust stock market but plummeted in 2022 following a market downturn. While the market bounced back by late 2023, the state continued to collect less tax revenue than projected in part due to something called “capital loss carryover,” which allows losses from previous years to reduce how much an individual is taxed.
- Second, the IRS extended the tax filing deadline for most California taxpayers in 2023 following severe winter storms, delaying the revelation of reduced tax receipts. When these receipts were able to eventually be processed, they were 22% below expectations. Without the filing delay, the revenue drop would have been incorporated into last year’s budget and the shortfall this year would be significantly smaller.
CALIFORNIA’S ECONOMY REMAINS STRONG: The Governor’s revised balanced budget sets the state up for continued economic success. California’s economy remains the 5th largest economy in the world and for the first time in years, the state’s population is increasing and tourism spending recently experienced a record high. California is #1 in the nation for new business starts , #1 for access to venture capital funding , and the #1 state for manufacturing , high-tech , and agriculture .
Additional details on the May Revise proposal can be found in this fact sheet and at www.ebudget.ca.gov .
Article
- Volume 21, issue 9
- BG, 21, 2297–2311, 2024
- Peer review
- Related articles
Monitoring the impact of forest changes on carbon uptake with solar-induced fluorescence measurements from GOME-2A and TROPOMI for an Australian and Chinese case study
Juliëtte c. s. anema, klaas folkert boersma, piet stammes, gerbrand koren, william woodgate, philipp köhler, christian frankenberg, jacqui stol.
Reliable and robust monitoring tools are crucial to assess the effectiveness of land mitigation techniques (LMTs) in enhancing carbon uptake, enabling informed decision making by policymakers. This study, addressing one of the scientific goals of the EU Horizon 2020 Land Use Based Mitigation for Resilient Climate Pathways (LANDMARC) project, examines the feasibility of using satellite solar-induced fluorescence (SIF) in combination with other satellite data as a monitoring proxy to evaluate the effects of LMTs on carbon uptake. Two distinct cases are explored: (1) instantaneous vegetation destruction caused by a 2019 eucalyptus wildfire in southeast Australia and (2) gradual forest gain resulting from reforestation efforts in northern China in 2007–2012. The cases are monitored using SIF from the TROPOspheric Monitoring Instrument (TROPOMI) and Global Ozone Monitoring Experiment-2A (GOME-2A), respectively. Comparing the temporal variability in SIF across the affected areas and nearby reference areas reveals that vegetation dynamics changed as a consequence of the land-use changes in both cases. Specifically, in the Australia case, TROPOMI demonstrated an immediate reduction in the SIF signal of 0.6 mW m −2 sr −1 nm −1 ( − 72 %) over the eucalypt forest right after the fire. Exploiting the strong correspondence between TROPOMI SIF and gross primary productivity (GPP) at the nearby representative eddy covariance Tumbarumba site and through the FluxSat product, we estimate that the Australian fire led to a loss in GPP of 130–200 GgC in the first 8 months after the fire. Over the northern Chinese provinces of Gansu, Shaanxi, Sichuan, Chongqing, and Shanxi, we report an increase in GOME-2A summertime SIF of 0.1–0.2 mW m −2 sr −1 nm −1 , coinciding with reforestation efforts between 2007 and 2012. This increase in the SIF signal is likely driven by a combination of increasingly favourable natural conditions and by the reforestation effort itself. A multivariate model that takes into account growth factors such as water availability and maximum temperature as well as satellite-derived forest-cover data explains the observed variability in GOME-2A SIF in the Chinese case reasonably well ( R 2 =0.72 ). The model suggests that increases in both forest cover and soil moisture have led, in step, to the observed increase in vegetation activity over northern China. In that region, for every 100 km 2 of additional forest cover, SIF increases by 0.1 mW m −2 sr −1 nm −1 between 2007 and 2012. Our study highlights that the use of satellite-based SIF, together with supporting in situ, modelled, and satellite data, allows us to monitor the impact of LMT implementation on regional carbon uptake as long as the scale of the LMT is of sufficient spatial extent.
- Article (PDF, 3775 KB)
- Supplement (979 KB)
- Article (3775 KB)
- Full-text XML

Anema, J. C. S., Boersma, K. F., Stammes, P., Koren, G., Woodgate, W., Köhler, P., Frankenberg, C., and Stol, J.: Monitoring the impact of forest changes on carbon uptake with solar-induced fluorescence measurements from GOME-2A and TROPOMI for an Australian and Chinese case study, Biogeosciences, 21, 2297–2311, https://doi.org/10.5194/bg-21-2297-2024, 2024.
Photosynthetic carbon uptake by the terrestrial biosphere plays a crucial part in the carbon cycle and is the largest flux that contributes to the carbon sink. Over the last 60 years, the terrestrial biosphere captured an amount of carbon equivalent to approximately 32 % of the total anthropogenic emissions in that period ( Friedlingstein et al. , 2020 ) . However, the ongoing efficacy of this photosynthetic carbon flux, or gross primary productivity (GPP), is not assured due to feedback mechanisms driven by climate change and human activity (e.g. Brook et al. , 2013 ; Huntzinger et al. , 2017 ) . Preserving the terrestrial biosphere's pivotal role in dampening the rise in atmospheric CO 2 concentrations is crucial to address the current climate crisis. In response to this urgency, land mitigation techniques (LMTs) play a key role as negative carbon technology in national climate strategies ( United Nations , 2016 ) and in the climate pathways of the Intergovernmental Panel on Climate Change ( Rogelj et al. , 2018 ) . These techniques include a variety of practices, such as reforestation and fire management, aimed at enhancing the land's carbon assimilation and preventing carbon stock loss.
The potential of large-scale LMT implementation is exemplified by observed greening trends over actively reforested areas across central to northern China ( Chu et al. , 2019 ; Gerlein-Safdi et al. , 2020 ) . However, persisting uncertainty regarding the LMTs' effectiveness in enhancing GPP and carbon sequestration in the long term limits their widespread implementation (e.g. Harper et al. , 2018 ) . The need for robust quantification of changing GPP following land-cover change is further emphasized by the uncertain impacts of rising atmospheric CO 2 concentrations and climate change itself on the terrestrial biosphere ( Schimel et al. , 2015 ; Smith et al. , 2020 ; Duffy et al. , 2021 ; Schurgers et al. , 2018 ) . Understanding the efficiency and applicability of LMTs is essential for effective climate action. Therefore, the Horizon 2020 LANDMARC (Land Use Based Mitigation for Resilient Climate Pathways) project ( https://www.landmarc2020.eu/ , last access: 8 June 2023) has developed monitoring tools, including satellite-based remote sensing, to study the feasibility of negative emission monitoring using multiple LMT cases worldwide as test cases.
The recent development of satellite-based measurements of solar-induced chlorophyll fluorescence (SIF) from atmospheric sensors has opened up promising opportunities to monitor the GPP dynamics ( Frankenberg et al. , 2011 ; Joiner et al. , 2011 ) . Chlorophyll fluorescence (660–850 nm) is the re-emission of the absorbed photosynthetically active radiation (APAR) by the leaf chlorophyll during photosynthesis ( Frankenberg and Berry , 2017 ) . The emission of fluorescence dissipates part of the excitation energy from APAR that is not transported to and used by the photochemical reactions in the plant – making both fluorescence and GPP dependent on APAR ( Porcar-Castell et al. , 2014 ) . SIF measurements depict the captured chlorophyll photons integrated over the canopy within the field of view and thus directly follow the dynamics of photosynthetic activity. Therefore, SIF follows GPP more consistently than traditional greenness parameter observations such as NDVI (e.g. Magney et al. , 2019 ; Gerlein-Safdi et al. , 2020 ) .
As part of one of the research objectives of the LANDMARC project, the main goal of this study is to assess the feasibility of satellite-based SIF in combination with other satellite data to monitor the effect of land mitigation techniques (LMTs) on carbon uptake. Monitoring tools could potentially benefit from the ability of SIF to track GPP dynamics consistently across various biomes and scales ( Zhang and Schwärzel , 2017 ; Verma et al. , 2017 ; Dechant et al. , 2020 ) and from its demonstrated sensitivity to climate stress ( Song et al. , 2018 ; Ač et al. , 2015 ) . Previous studies indicated the ability of SIF to evaluate changes in land cover ( Gerlein-Safdi et al. , 2020 ; Guo et al. , 2021 ) . However, to our knowledge, the use of SIF aligned with supporting satellite data to quantify the isolated effect of land-use change on GPP has not been assessed.
Here, we use TROPOMI and GOME-2A SIF to monitor two cases of forest-cover change. First, we use monthly TROPOMI SIF to track the aftermath of a 2019 wildfire in southeast Australia, impacting around 210 km 2 of eucalypt forest. Next, we use summertime GOME-2A SIF to monitor multi-year reforestation efforts in northern China from 2007–2012. The Australian case acts as a proof of concept due to its immediate and distinct single-cause land-cover change, while the Chinese case tests how SIF can be used to monitor the combined effect of gradual forest-cover change and variability in growth conditions (water and radiation availability) ( Gao et al. , 2019 ; Lin et al. , 2020 ; Wang et al. , 2022 ) . Satellite-based data, including MODIS burned-area data and Landsat-derived annual land-cover data, are used to evaluate the spatial and temporal extent of the changed forest cover in both cases. Subsequently, a comparative analysis between the impacted and reference areas was conducted.
Our study addresses the following research questions. (1) Is it possible to monitor changes in vegetation dynamics that are linked to instantaneous or gradual land-cover changes over scales that can be resolved by the TROPOMI and GOME-2A sensors? (2) How can we quantify the impact of instantaneous land-use change on carbon uptake? (3) How can we use remotely sensed metrics to improve our understanding of climate variability and forest-cover change on interannual SIF?
2.1 Space-based SIF observations
Satellite measurements of SIF are powerful proxies for vegetation growth, and they have been used in many studies to monitor the changes in GPP. Retrieval of SIF from satellite measurements, e.g. from GOME-2A and TROPOMI that offer near-daily global coverage, relies on the relative filling in of solar Fraunhofer lines in the Earth's radiance spectra. The apparent depth of the Fraunhofer lines is not affected by scattering or reflection from clouds or by the Earth's surface. However, if vegetation is present on the surface, the addition of solar-induced fluorescence (SIF) as a spectrally continuous surface light source dampens the relative depth of the lines, and this (relative) filling in of the Fraunhofer lines is a measure of the strength of fluorescence ( Joiner et al. , 2011 ; Frankenberg et al. , 2011 ) . The spectral-fitting window is made wide enough to cover multiple strong Fraunhofer lines and sufficiently narrow as to limit the presence of atmospheric absorption features. Spectral-basis functions derived from observations over vegetation-free non-fluorescent areas are used to describe the impact of atmospheric interaction and possible instrumental artefacts – the reference set. Accordingly, the SIF signal is computed by fitting the satellite-observed spectrum with a modelled reflectance spectrum assembled from the spectral-basis functions. Uncertainty in the SIF data emerges from measurement noise, the presence of optically thick clouds in the satellite field of view, and the fitting procedure, the latter depending on the quality and representativeness of the spectral-basis functions. To mitigate uncertainty, SIF observations with cloud cover fractions below 0.2 are used.
2.1.1 SIF retrieved from TROPOMI
In this study, we use level-2 SIF (740 nm) data retrieved from the TROPOspheric Monitoring Instrument (TROPOMI) by Caltech ( Köhler et al. , 2018 ) . TROPOMI is an atmospheric spectrometer on board the Sentinel-5 Precursor that performs in a wide spectral range from the ultraviolet to the shortwave-infrared. The instrument was launched on 13 October 2017 and flies in a low-Earth polar sun-synchronous orbit with equatorial crossing at 13:30 local solar time (LST) and with a repeat cycle of 17 d ( Veefkind et al. , 2012 ) . The 2600 km wide swath enables almost daily global coverage. TROPOMI SIF, with a spatial resolution of 7 × 3.5 km 2 at nadir, is retrieved from a subset of the NIR band with a selected window ranging from 743 to 758 nm. TROPOMI SIF has a single-pixel 1 σ uncertainty in the range of 0.3–0.5 mW m −2 sr −1 nm −1 ( Köhler et al. , 2018 ) .
TROPOMI SIF has been previously used to track photosynthetic activity following extreme precipitation events in the US ( Turner et al. , 2021 ) , during the dry season in the Amazon forest ( Doughty et al. , 2019 ) , and over evergreen forests ( Magney et al. , 2019 ) . Furthermore, it is extensively validated with GPP from multiple eddy covariance towers and with Orbiting Carbon Observatory-2 (OCO-2) SIF ( Li and Xiao , 2022 ; Köhler et al. , 2018 ) . Until ESA's FLEX mission with a spatial resolution of 300 m ( Drusch et al. , 2016 ) is launched (in 2025), TROPOMI SIF is arguably the most appropriate data product to track photosynthetic activity from vegetation on a global scale from space. The main limiters in detecting the impact of LMTs on vegetation activity are the spatial scale of a TROPOMI pixel ( ± 20 km 2 ) and the data not being available before April 2018.
2.1.2 SIF retrieved from GOME-2A
We also use clear-sky, gridded (level-3) SIF data from the Royal Netherlands Meteorological Institute (KNMI) Sun-Induced Fluorescence of Terrestrial Ecosystems Retrieval (SIFTER) v2 product ( Kooreman et al. , 2020 ; Van Schaik et al. , 2020 ) retrieved from the Global Ozone Monitoring Experiment-2A (GOME-2A) sensor. The data have a spatial resolution of 0.5° × 0.5°. GOME-2A was launched on 6 November 2006 aboard the Meteorological Operational (Metop-A) satellite and flies in a sun-synchronous orbit with equatorial crossing at 09:30 LST. The GOME-2A swath covers 1920 km, resulting in a spatial resolution of 80 × 40 km 2 at nadir. Due to a swath reduction on 15 July 2013, the spectral resolution thereafter was 40 × 40 km 2 . Despite the 160-times-coarser resolution of GOME-2A in comparison to TROPOMI, the GOME-2A SIF data are of relevance due to the long temporal record, starting from 2007. The GOME-2A SIF product is retrieved from a subset of band 4 with a selected window ranging from 734 to 758 nm, and the SIFTER retrieval principle is similar to that of TROPOMI SIF. GOME-2A SIF has a single-pixel uncertainty on the order of 0.6 mW m −2 sr −1 nm −1 ( Van Schaik et al. , 2020 ) . The retrieval is considered most reliable in the period before the sensor switch in July 2013 ( Van Schaik et al. , 2020 ) . After the July 2013 switch, degradation of the GOME-2A sensor and subsequent calibration updates in different level-1 data versions have posed difficulties in deriving a consistent, bias-free data record. Post hoc degradation corrections introduced in Van Schaik et al. ( 2020 ) have (at least partly) improved the consistency of the GOME-2A SIF data record in the post-2013 years.
We exclusively use the GOME-2A data from the years 2007–2012 for two main reasons. Firstly, this enables a constant satellite viewing geometry throughout the analysed time series. Secondly, we limit level-1 calibration issues associated with strong instrument degradation and unresolved differences in level-1 calibration post-processing within the dataset ( Van Schaik et al. , 2020 ; Gerlein-Safdi et al. , 2020 ) . Additionally, we applied a year-specific multiplicative correction to the SIF data, addressing the effect of instrument degradation on SIF. The corrections are determined over China's Gobi Desert, where vegetation is mostly absent and a constant near-zero SIF signal is expected. Supplement S1 describes the correction procedure in detail, and we note here that the (multiplicative) correction factors have values between 0.85 and 1.12 and that their application improves the correspondence between GOME-2A SIF and FluxSat GPP over northern China (Fig. S3).
Various applications have shown the data to be of good use for detecting the effects of heatwaves on GPP in Europe ( Wang et al. , 2020 ) , quantifying GPP over Africa ( Getachew Mengistu et al. , 2021 ) , and mapping the impact of El Niño on forest productivity in the Amazon ( Fancourt et al. , 2022 ) . GOME-2A SIF has been validated with GPP from various eddy covariance flux towers in Africa ( Getachew Mengistu et al. , 2021 ) .
2.2 Gross primary productivity (GPP) data
2.2.1 gpp from tumbarumba flux tower.
This study uses estimated GPP data from the Tumbarumba OzFlux eddy covariance flux tower site as a ground reference to the TROPOMI SIF observations (AU-TUM, 35.66° N, 148.15° E; Stol and Kitchen , 2022 ) . The Tumbarumba site is located in the Bago State Forest and is predominately covered by eucalyptus forest. GPP is not directly measured but is calculated using partitioning methods by the extraction of modelled respiration from the measured net ecosystem exchange (NEE) of CO 2 . NEE at the site is quantified using the eddy covariance method, which involves simultaneously measuring vertical wind speed and CO 2 concentration ( Moene and Van Dam , 2014 ) .
For our analysis, we use the quality-checked and gap-filled daily GPP (in gC m 2 d −1 ) from the level-6 data. The Tumbarumba data are processed following the standard tool developed by OzFlux, which is described in more detail in Isaac et al. ( 2017 ) . To match the recording time of TROPOMI SIF and account for the impact of the Dunn's Road fire that affected the OzFlux site in December 2020, GPP data between February 2018 and November 2020 are used.
2.2.2 FluxSat GPP product
The modelled global FluxSat GPP product is used as independent GPP data to compare against SIF and the OzFlux GPP data for the Australia case study. The dataset contains daily averaged GPP estimates (gC m −2 d −1 ) at a spatial resolution of 0.05° × 0.05° over the period from March 2000 to August 2020. The FluxSat GPP product was found to agree well with GPP from flux towers ( Joiner et al. , 2018 ) , and TROPOMI-inferred GPP ( Turner et al. , 2021 ) and has previously been used to quantify changes in carbon uptake (e.g. Byrne et al. , 2021 ; Bacour et al. , 2019 ) .
The global FluxSat GPP ( Joiner et al. , 2018 ) product is derived from the evaluation and training of satellite-data-driven models that are based on the light use efficiency concept ( Monteith , 1972 ) , which states that there is a linear relationship between GPP and the absorbed photosynthetically active radiation. The product's objective is to estimate GPP accurately at a high temporal (daily) and spatial resolution. MODIS reflectance (MCD43) data serve as vegetation index inputs for the model. Furthermore, the models are trained and calibrated using a subset of eddy covariance flux data that contains data across various plant types. In addition, GOME-2A SIF (v27; Joiner et al. , 2013 , 2016 ) , a different SIF product from NASA, is used in the FluxSat calibration procedure to delineate highly productive regions that are not well fitted and are underestimated using the global regression model. Guanter et al. ( 2014 ) found that high GPP values from cropland deviated from the linear relationship. Therefore, highly productive regions were trained and calibrated separately using an eddy covariance GPP subset that met the high SIF and GPP criteria ( Joiner et al. , 2018 ) . As GOME-2A SIF is merely used to identify productive areas, FluxSat GPP estimates remain largely independent from SIF.
We first investigate the case of a 2019 eucalyptus wildfire in southeastern Australia to evaluate the ability of SIF to capture the fire-induced change in vegetation dynamics. Lightning strikes on 16 January 2019 ignited multiple fires across remote forested areas in Victoria, southeast Australia. Strong northwesterly winds propagated and coalesced several individual fires into a clustered eucalyptus fire, which is locally known as the Nunnett–Timbarra River fire due to its extent between the Nunnett State Forest and the Timbarra River. Burning for nearly 4 weeks, the wildfire impacted around 210 km 2 of eucalyptus forest spanning from 37.35–37.2° S to 148.0–148.2° E. The impacted area had not previously been affected by wildfires within the 25 years prior to the event ( Lindenmayer and Taylor , 2020 ) . The fire has been documented to have caused a sharp reduction in leaf biomass in January 2019 but left eucalypt tree stems and branches mostly intact, according to witness reports by the Australian Forestry Service.
Figure 1 shows the location of the area impacted by the Nunnett–Timbarra River fire in the context of the wider biogeography of southeast Australia. Notably, Fig. 1 c and d show that prior to the fire, the area enclosed by the solid line (which would burn down in early 2019) as well as the surrounding area bound by the dashed line (which was spared from the fire) had high levels of SIF and GPP, indicating vigorous growth conditions in both areas under normal circumstances.

Figure 1 Location and extent of the Nunnett–Timbarra River fire and selected reference area. Maps of (a) the burned area per month of burn from the MODIS MCD64A1 Burned Area product ( Giglio et al. , 2015 ) , (b) dominant land cover over the area with classification based on the 2015 Land Cover Dataset ( Lymburner et al. , 2015 ) , (c) monthly mean TROPOMI SIF (0.05° × 0.05°), and (d) monthly mean FluxSat GPP (0.05° × 0.05°) in April 2018. The outlines of the burned area (approximately 210 km 2 ) and reference area (approximately 975 km 2 ) are indicated by the solid and dashed lines, respectively. Location of the Tumbarumba OzFlux site (AU-TUM) used in this study is shown as a black star.
3.1 Reduction in SIF following the eucalyptus forest fire
We evaluate the spatial and temporal trends in TROPOMI SIF over the burned area from February 2018 until November 2020. The monitoring period ends in November 2020 to avoid potential interference from subsequent wildfire events that occurred in December 2020 and affected the studied region ( Bowman et al. , 2021 ) . The extent of the eucalyptus fire is identified using the MODIS MCD64A1 Burned Area monthly product ( Giglio et al. , 2015 ) (Fig. 2 a), and the impacted burned area is defined as the region encompassing the MODIS burned pixels, indicated by the solid lines in Figs. 1 and 2 a and b. Next, for comparison, we carefully selected a reference area surrounding the burned area that remained unaffected by the fire. This reference area was chosen to closely match the biogeography of the impacted area, consisting of a mixture of open and closed eucalyptus forest (Fig. 1 b). SIF observations over the reference area are assumed to represent the forest dynamics over the burned area as if the fire had not taken place.
To evaluate temporal trends in SIF over both areas, we categorized TROPOMI level-2 pixels as either “burned” or “reference” based on their spatial overlap with each respective area. Criteria were implemented for each group to ensure pixel exclusivity and minimize interference. Pixels were labelled as burned if the burned-area fraction exceeded 50 %. Pixels were labelled as reference if they comprised less than 30 % of the burned area. Subsequently, within each group, the SIF values were averaged on a monthly basis. Note that throughout the reporting of the results, all uncertainty values are stated in standard error (SE).

Figure 2 Impact of the 2019 eucalyptus fire on TROPOMI SIF over time and in comparison to the unburned reference area and pre-fire conditions. Map of (a) the burned area and specific burn data at a 1 km scale from the MODIS MCD64A1 Burned Area product and (b) the difference in SIF between post- (2019) and pre-fire (2018) conditions in March–May (autumn). Brown indicates higher SIF in 2018 (pre-fire); green indicates higher SIF in 2019 (post-fire). (c) Correlation between SIF in March–May 2019 (post-fire) and the coverage of the 500 m burned-area pixels by the SIF pixels, in percentage.
Figure 2 b shows the difference in SIF between autumn 2019 (post-fire) and 2018 (pre-fire). Over the area that burned down, autumnal SIF values in 2019 decreased significantly compared those in to 2018. In contrast, SIF at the reference area remained consistent across both years. Furthermore, the lowest SIF values (0.25 mW m −2 sr −1 nm −1 ) coincide with pixels with burned-area fractions higher than 60 %, whereas SIF is much higher (0.45 mW m −2 sr −1 nm −1 ) in pixels that had not burned, as illustrated in Fig. 2 c. We conclude that TROPOMI SIF is capable of capturing the strong reduction in vegetation activity over the burned area relative to the unburned reference area, noting that the affected area extends over some 200 km 2 , equivalent to eight individual TROPOMI pixels.

Figure 3 Time series of SIF over the burned and reference areas (a) prior to the fire in 2018 and (b) during and after the fire in 2019. The shaded red and blue areas represent the standard error (SE) in monthly SIF over the burned and reference areas, respectively. The right y axis of panel (b) shows the reduction in SIF (in %) over the burned area ( F B ) as compared to SIF over the reference area ( F R ), which is calculated as 1 - F R - F B F R . Prior to monthly averaging, SIF pixels beyond ± 2 σ from their respective seasonal group mean were removed.
Figure 3 a shows the seasonal cycle in 2018 (pre-fire) inferred from TROPOMI SIF over the to-be-burned and reference areas. Prior to the fire event, the observed SIF values indicate consistency and strong agreement between the two areas ( r =0.97 ; Fig. S4a). However, shortly after the fire, a substantial reduction in SIF over the burned area becomes evident (Fig. 3 b). This immediate fire-induced impact is highlighted by a striking 72 % decrease in February SIF values compared to those of the reference area. In the subsequent months, the vegetation activity over the burned area remained low but non-zero, with an averaged SIF of 0.26 ± 0.01 mW m −2 sr −1 nm −1 between February and August 2019. During springtime (September–November), vegetation recovery was noticeable, with SIF values reaching 0.43 ± 0.04 mW m −2 sr −1 nm −1 by November. In fact, SIF grew faster in springtime over the burned area than over the reference area, with respective increases of 208 % and 144 %, hinting at accelerated regrowth in a moderately burned area, a trend which has also been reported in Zambia and Alaska ( Chungu et al. , 2020 ; Madani et al. , 2021 ) .

Figure 4 Reduction in GPP following the eucalyptus wildfire over the first 8 months post-fire (February–November 2019). (a) Time series of reduced GPP and (b) bar plot of total reduction obtained from SIF-based GPP using data from the Tumbarumba eddy covariance site (GPP SIF, ec ), SIF-based GPP using FluxSat GPP (GPP SIF, FluxSat ) over Tumbarumba, and FluxSat GPP (GPP FluxSat ), shown in dark blue, light blue, and purple, respectively.
3.2 Quantifying the fire-induced reduction in GPP
Next, based on the observed reduction in SIF, we quantify the fire-induced reduction in GPP. Previous studies found space-based SIF observations to be proportional to GPP at the canopy scale. This proportionality is defined by biome-specific linear relationships that are widely used to scale SIF to GPP (e.g. Turner et al. , 2020 ; Liu et al. , 2017 ; Sun et al. , 2018 ) . Building upon this recognized relationship between SIF and GPP, we assume that the relative reduction in SIF (Sect. 3.1 ) represents the loss in GPP ( Δ SIF ∝ Δ GPP). Consequently, we express the fire-induced change in GPP over the burned area Δ M B ( t ) (in gC m −2 d −1 ) over month t as the product of the relative change in SIF ( Δ F B ( t ) ) and the “baseline” GPP ( M R ( t )) over the reference area (as if no fire had occurred):
To compute the SIF-based GPP over the reference area ( M R ( t )), we first characterize the SIF–GPP relationship using GPP data from a representative eddy covariance site (see Supplement S2). Specifically, GPP data from the nearby Tumbarumba (AU-TUM) site ( Stol and Kitchen , 2022 ) are used to compare against TROPOMI SIF. We obtain the SIF-based GPP over the reference area using the following equation:
where F R ( t ) represents the SIF evolution over the reference area and M TUM F TUM is the local SIF–GPP relationship over the Tumbarumba flux site. We hold the empirical SIF–GPP relationship over Tumbarumba to be applicable to our study area. This is supported by (i) the similar biogeography of lowland eucalyptus forest in both areas (Fig. 1 b), (ii) the strong spatiotemporal correlation between TROPOMI SIF over Tumbarumba and over the reference area in the year prior to the fire ( r =0.92 ; Fig. S4b), and (iii) the good correlation between FluxSat GPP estimates over Tumbarumba and over the reference area in the year prior to the fire ( r =0.79 ; Fig. S4c). Moreover, the discrepancy between SIF–GPP FluxSat over Tumbarumba and the Nunnett–Timbarra River area is small: on the order of 4 % (Supplement S2.1)
As an alternative, we also compute SIF–GPP relationships over Tumbarumba using TROPOMI SIF and modelled FluxSat GPP. The temporal dynamics of TROPOMI SIF exhibit strong consistency with both the GPP estimated from eddy covariance flux tower data ( r =0.91 ) and the modelled (FluxSat) GPP ( r =0.94 ), providing some confidence in both estimates. However, the SIF–GPP relationship based on the flux tower GPP measurements is 1.6 times stronger than the relationship based on the FluxSat GPP data (Table S2.1, Fig. S5a). This discrepancy likely arises from higher GPP estimates from the eddy covariance flux tower – nearly twice that of the estimates from FluxSat (Fig. S5b) – and inherited uncertainties and biases in the estimates of the FluxSat GPP product. Our findings are consistent with Joiner et al. ( 2018 ) , who also observed magnitude differences up to a factor of 2 between FluxSat GPP and independent FLUXNET 2015 GPP data at some sites. Despite differing footprint sizes between the Tumbarumba tower and FluxSat model, this is not expected to significantly impact the uncertainty, given the extensive land cover around the tower (Supplement S2.1).

Figure 5 Location and extent of the reforestation efforts between 2007 and 2012 over the study region in northern China. Maps of (a) changed forest cover in 2012 with respect to 2007 (in % of cell area) obtained from the China land-cover dataset (CLCD) ( Yang and Huang , 2021 ) , with green indicating higher forest coverage in 2012 (reforestation) and brown indicating higher forest coverage in 2007 (deforestation) and (b) dominant land cover in 2007 with classification based on the CLCD, aggregated over the 0.5° × 0.5° GOME-2A SIF grid. Croplands are shown in yellow, grasslands in light green, and forests in dark green. Maps of (c) GOME-2A SIF ( Van Schaik et al. , 2020 ) and (d) FluxSat GPP ( Joiner et al. , 2018 ) , averaged over summertime (June–August) 2007. Selected reforested cells and deforested cells are indicated by black-filled and white-filled circles, respectively.
Finally, we estimate the reduction in GPP employing SIF–GPP relationships that use (1) the eddy covariance GPP data and (2) FluxSat GPP data over Tumbarumba – hereon referred to as GPP SIF, ec and GPP SIF, FluxSat , respectively. Additionally, we compute the reduction in GPP from the FluxSat GPP data directly over the burned and reference areas, referred to as GPP FluxSat . Figure S6 shows an overview of the three approaches to compute Δ GPP.
Figure 4 a shows the estimated fire-induced reductions in GPP over time. The SIF-based approaches, GPP SIF, ec and GPP SIF, FluxSat , show a sharp reduction in GPP immediately after the fire. This is followed by smaller GPP deficits in winter, when vegetation activity is low. The FluxSat data (GPP FluxSat ) also show a direct local impact of the wildfire on GPP. However, the FluxSat data suggest an almost complete recovery in November, in contrast to our SIF-based results.
When integrated over the period from February to November 2019 and across the burned area, we find SIF-based GPP losses Δ GPP SIF, ec and Δ GPP SIF, FluxSat of 198 and 132 GgC, respectively. The SIF-based GPP losses reflect a reduction of 48 % with respect to GPP over the same period in the reference area. Thus, the estimated SIF-based losses are in the range of 130–200 GgC over the initial 8 months post-fire. For comparison, Δ GPP FluxSat indicates a fire-induced loss of 150 GgC over the burned area between February–November compared to the reference area. The total GPP FluxSat over the burned area during this period is 58 % less than over the same period and area in 2018 (pre-fire conditions).
An uncertainty propagation analysis, described in Supplement S2.1, indicates a total uncertainty of approximately 60 % in the estimated SIF-based GPP losses. This total uncertainty is primarily driven by the use of the SIF–GPP relationship at Tumbarumba, where no fire occurred, to derive our GPP-loss estimate via Eq. ( 2 ) over the Nunnett–Timbarra River area that burned down – introducing an estimated uncertainty of 50 %. This uncertainty was determined by comparing SIF and FluxSat GPP relationships under pre-fire and post-fire conditions (see point 2 in Supplement S2.1). We conclude that estimating changes in GPP based on land-cover changes is possible with TROPOMI SIF in combination with empirical SIF–GPP relationships, at least when such land-cover changes occur over a spatial scale of a few hundred km 2 .
We now turn to examining how GOME-2A can be used to monitor the impact of reforestation on carbon uptake in parts of northern China. Our study area includes Shaanxi province, southwestern Shanxi, eastern Gansu, and part of northern Sichuan and Chongqing. This region spans approximately 31 to 38° N and 105.0 to 111.5° W (Fig. 5 a). Over the past 15 years, the area has undergone various greening campaigns like Grain for Green, the Natural Forest Conservation Program, and the Three-North Shelterbelt Program ( Delang and Yuan , 2015 ; Kong et al. , 2021 ) . These efforts have led to observable positive trends in vegetation activity ( Gerlein-Safdi et al. , 2020 ; Lin et al. , 2020 ; Li et al. , 2015 ; Sun et al. , 2015 ; Cao et al. , 2009 ) .

Figure 6 Impact of increased forest coverage in northern China between 2007 and 2012. Maps of changed (a) forest coverage (in km 2 ) calculated from the China land-cover dataset ( Yang and Huang , 2021 ) and (b) summertime GOME-2A SIF during the 6 years. Green indicates higher forest coverage/SIF in 2012 and brown indicates higher forest coverage/SIF in 2007. (c) Contrast in GOME-2A SIF trends between 2007 and 2012 over the deforested and reforested cells. The reforested and deforested cells are indicated by black-filled and white-filled circles in (a) and (b) . The SIF data are obtained from the GOME-2A SIFTER v2 dataset by Van Schaik et al. ( 2020 )
Figure 5 a and b show that most of the forest gain occurred within and at the borders of Shaanxi province, predominantly over areas dominated by forest or cropland cover. Concurrently, Fig. 5 c and d show that high SIF and FluxSat GPP values generally occur in the vegetated southern part of the domain, including the regions where reforestation has taken place, with lower average SIF and GPP values observed in the drier northern part of the region.
4.1 Coinciding increase in forest cover and SIF
We first examine the 2007–2012 variability in summertime (June–August) GOME-2A SIF, when vegetation productivity is at a maximum. To evaluate the changes in SIF, we used the first Landsat-derived annual China land-cover dataset (CLCD) ( Yang and Huang , 2021 ) . These satellite-based data categorize nine major land types such as cropland, forest, and grassland at a spatial resolution of 30 m. Specifically, we extracted forest-coverage data for each year between 2007 and 2012, aggregated over the 0.5° × 0.5° GOME-2A SIF grid. The conversion to forest, from any type of land cover, was determined by quantifying the change in forest cover relative to the 2007 baseline. We then compared changes in summertime SIF between 2007 and 2012 over two contrasting groups of cells: reforested ( n =42 ) and deforested ( n =8 ). We classify cells as “reforested” if they gained more than 2 % of their area in forest coverage (approximately 50 km 2 ) and as “deforested” ( n =8 ) if they lost forest coverage during this period, as shown in Fig. 6 a. Cells in both groups consistently gained or lost forest coverage with every passing year from 2007 to 2012.
The majority of reforested cells showed an increase in average summertime SIF, whereas most deforested cells experienced a decrease (Fig. 6 b). Figure 6 c shows the clear contrast in SIF trends across cells that gained forest coverage compared to those that lost forest coverage. Reforested cells exhibited a significant increase in SIF of 0.17 ± 0.03 mW m −2 sr −1 nm −1 , while SIF decreased by 0.09 ± 0.07 mW m −2 sr −1 nm −1 over the deforested cells between 2007 and 2012. The contrasting trends in vegetation activity indicated by GOME-2A SIF over the reforested and deforested cells are confirmed by co-sampled independent data from the near-infrared reflectance of vegetation (NIRv) and FluxSat GPP (Fig. 7 a and b).

Figure 7 Contrast in changed vegetation activity between deforested and reforested cells between 2012 and 2007, shown using (a) FluxSat GPP and (b) the near-infrared reflectance of vegetation (NIRv) retrieved from MODIS.
Temporal SIF variability across northern China is driven not only by reforestation alone but also by co-occurring changes in local climate factors that influence plant growth, such as water availability, heat, and the presence of photosynthetically active radiation ( Zhang and Ye , 2021 ; Gao et al. , 2019 ; Lin et al. , 2020 ) . To examine the co-occurring impact of climate variability and changes in forest cover, we use satellite-based soil moisture and maximum temperature. Soil moisture data were obtained from the Surface Soil Moisture (Active) product ( Dorigo et al. , 2019 ) and the daily maximum temperature was derived from hourly 2 m temperature from ERA5-Land data ( Muñoz Sabater , 2019 ) . Both were aggregated to the 0.5° GOME-2A SIF grid. The summers from 2007 to 2012 in Shaanxi and surrounding provinces are characterized by soil moisture values (50 %–55 %; Fig. S7b) that are generally good for plant growth, showed a slight increase over time (1 % yr −1 ), and had relatively stable (average) maximum temperatures (Fig. S7a). The summer of 2010 was somewhat of an exception, with a maximum temperature more than 1 °C below the multi-annual mean, which we interpret as indicating lower radiation levels. Overall, we expect that interannual variability in climate factors favoured forest growth between 2007 and 2012 in both the reforested and deforested areas, in line with previous studies (e.g. Zhang et al. , 2022 ) . Overall conditions for vegetation growth appear more favourable in cells where reforestation occurred, as maximum temperatures were more moderate (23 °C) and soil moisture was higher (53 %) in the cells with reforestation than in cells with deforestation.
4.2 Interpretation of temporal variability in SIF
We constructed a simple model that expresses the local year-to-year variability in summertime SIF as a linear combination of soil moisture ( S ; in %), maximum temperature ( T ; in °C) averaged over spring to summertime (March–August), and the total forest coverage ( A ; in km 2 ): Eq. ( 3 ). This model serves to explore the impact of different climatic drivers on observed SIF, representing vegetation activity, alongside the effect of change in vegetation. The selection of this model is motivated by three factors: (i) soil moisture promotes the thriving of vegetation by enhancing the water availability, (ii) increasing temperature stimulates vegetation activity until an optimal temperature is reached ( Gao et al. , 2019 ) and is a proxy for photosynthetic active radiation, and (iii) total photosynthetic carbon uptake increases with increasing vegetation cover. Note that the climate parameters are averaged over the spring and summer period (March–Aug) to account for the concurrent and lagging effects on the vegetation activity over summer (e.g. Sun et al. , 2021 ).
We use a multivariate-least-squares regression to optimize the combined fit coefficients that best explain the observed SIF over the reforested and deforested cells. Modelled SIF as a function of the year (between 2007 and 2012), F mod ( t ), is expressed as
where α , β , γ , and δ represent the coefficients that minimize the discrepancies ( ϵ ) between F mod ( t ) and the observed GOME-2A time series F obs ( t ). The predictors of soil moisture, maximum temperature, and forest cover are indicated by S ( t ), T ( t ), and A ( t ), respectively, over the year t . To ensure sufficient statistics, we pooled the time series of SIF ( n =6 ) from all 50 selected cells, resulting in a single cell-ensemble fit. Overall, the modelled variability in SIF matches the measured variability reasonably well ( R 2 =0.57 ; n =300 ). Figure 8 a shows the correlation between the observed ( F obs ) and modelled ( F mod ) SIF over all cells.

Figure 8 Results from the regression model in Eq. ( 3 ) fitted to (a) all cells ( n =50 ) and (b) exclusively forest and grassland cells ( n =36 ). Panel (c) shows the correlation between observed ( F obs ) and modelled ( F mod ) SIF for each dominant land type and for both fits.
However, the model's performance varied by land-use type across the region (Fig. 8 c). Notably, it demonstrated good agreement between observed and modelled values for cells dominated by grassland ( r =0.84 ) or forest cover ( r =0.58 ) but struggled to represent the dynamics in cropland cells ( r =0.27 ). This suggests distinct differences in the underlying dynamics and complexities in converting cropland areas into forest. Previous studies reported that croplands were often located in drier areas with less forest cover to begin with, reducing the vigour with which vegetation increases in response to reforestation ( Qu et al. , 2020 ) .
We therefore exclusively fitted our final model to data from the 36 cells dominated by grassland or forest cover ( n =216 ; Fig. 8 b and c). By excluding cropland cells, the fit significantly improved, evident from the higher R 2 of 0.72. The improved correlation between the observed and modelled SIF suggests that the model better captures the underlying dynamics. Note that the impact of different factors on the long-term vegetation dynamics is ecosystem-specific; therefore, our model is unique to the fitted area and period. Next, to evaluate the explanatory power of including forest coverage in our model, we constructed an alternative model that solely fits the first two terms on the right-hand side of Eq. ( 3 ), i.e. the climate parameters, to the observed summertime SIF. Doing so allows us to compute the adjusted R 2 of our model (Eq. 3 ) and the alternate model to enable fair comparison between the models containing three and two predictors. The alternate model had an adjusted R 2 of 0.66. With the inclusion of forest-cover data, the model's performance improved, achieving an adjusted R 2 of 0.71 – suggesting the added value of including changed forest coverage in conjunction with climate variability in the model.
Table 1 Regression results of the model fitted to GOME-2A summertime SIF temporal variability over reforested and deforested cells with a dominant land use of grassland or forest ( n =36 ). The model was fitted to data spanning 2007–2012. Uncertainty is given in standard error (SE).

* Over reforested cells ( =31 ).
Download Print Version | Download XLSX
The model's fit coefficients presented in Table 1 demonstrate, as hypothesized, that increases in the predictors positively influence SIF. Soil moisture and forest-cover variability explain most of the variability in GOME-2A SIF, as indicated by the scaled values of the fit coefficients (which consider predictor standard deviations). This is also expected, given the relatively strong increases in soil moisture ( + 5 %) and in forest cover ( + 97 km 2 ) compared to the modest changes in maximum temperature over the provinces from 2007 to 2012. The effect of changes in soil moisture cannot be disentangled from the effect of changes in forest cover on vegetation activity. However, our results show a positive impact of the forest-cover increase on vegetation activity. This is likely occurring in tandem with the changes in soil moisture because soils in regions with increased tree cover tend to hold on to their soil moisture better. We also tested a model including an additional (fourth) interaction term between soil moisture and reforestation, but this did not lead to an improved R 2 , adjusted between modelled and observed SIF. We conclude that vegetation activity following reforestation efforts increases most over the temperate areas in northern China classified as grassland and forest, with already relatively high soil moisture. On average, these areas show high covariance between changes in soil moisture and changes in forest cover, indicating that both factors explain the increase in summertime SIF.
Satellite-based solar-induced fluorescence (SIF) observations, a measure of plant photosynthesis, emerge as a promising tool to track changes in carbon uptake in response to land-use change. In this study we demonstrated that TROPOMI SIF captures sharp local reductions in vegetation activity – and thus carbon uptake in the aftermath of a large forest fire in southeastern Australia, the Nunnett–Timbarra River fire, in 2019 – and also that TROPOMI SIF tracks rapid recovery of vegetation activity in the affected area. By careful cross-evaluation of TROPOMI SIF with coinciding tower- and model-based estimates of global primary productivity (GPP), we estimate that the Nunnett–Timbarra River fire caused a reduction in SIF by on average 0.2 mW m −2 sr −1 nm −1 , corresponding to 130–200 GgC that would otherwise have been stored by the 210 km 2 eucalypt forest if no fire had occurred in the first 8 post-fire months. This shows that TROPOMI SIF is capable of monitoring sudden changes in vegetation activity at a scale of some 20 × 10 km 2 , and this predicts excellent potential for the Fluorescence Explorer (FLEX, to be launched in 2025) to monitor changes in carbon uptake from land management techniques, which often occur at much smaller spatial scales than the Nunnett–Timbarra River fire.
We also found increases in GOME-2A SIF of 0.1–0.2 mW m −2 sr −1 nm −1 over the provinces of Shaanxi, Gansu, Sichuan, and Chonqing in northern China in the period between 2007–2012, when China effectuated a large-scale reforestation programme aimed at reversing desertification. In contrast, in areas where deforestation occurred, GOME-2A SIF showed a reduction in SIF of 0.1 m −2 sr −1 nm −1 over the same period. The possibility of tracking reforestation (and deforestation) with GOME-2A SIF is supported by independent and co-sampled measurements from MODIS NIRv and by the FluxSat model product over the same areas also indicating increased (and decreased) vegetation activity. The relatively coarse-scale GOME-2A SIF measurements (40 × 80 km 2 ) indicate that vegetation activity increased the most in regions with relatively high soil moisture content and substantial reforestation as diagnosed by the China land-cover dataset. This suggests that reforestation is effective in enhancing carbon storage in the relatively wet and temperate regions of northern China but less so in the subtropical parts of the provinces, which are drier and hotter. Interpreting the observed temporal variability in GOME-2A SIF from 2007–2012 with a simple model that accounts for simultaneous spatiotemporal changes in soil moisture, in maximum temperature, and in forest cover, we found that the observed SIF changes in northern China can be explained well ( R 2 =0.72 ) over areas with forests and grasslands that underwent reforestation. Reforestation efforts, in step with soil moisture increases, appear to be driving the observed increase in SIF. This implies that the impact of reforestation on increases in SIF should be interpreted in the context of simultaneous increases in soil moisture.
Satellite-based SIF observations emerge as a promising method to facilitate the tracking of carbon uptake in response to land-use change. Through the analysis of two distinct cases of forest-cover change, we demonstrated the applicability of SIF as a monitoring tool in combination with satellite data that map the land-use change. The supporting data facilitate the pinpointing of SIF cells aligned with land-cover changes. Our comparative approach revealed distinct changes in SIF dynamics related to shifts in forest coverage. This underscores the capability of SIF to capture the impact of land-cover change, whether driven by distinct abrupt events or gradual transitions, on regional vegetation activity.
Our work underscores the fact that satellite measurements of SIF are useful to monitor changes in carbon uptake following land-use change as long as the spatial and temporal scales at which these occur are sharply demarcated. In this study, the availability of high-resolution MODIS burned-area data (pixel size 1 × 1 km 2 ) and TROPOMI SIF (pixel size 7 × 3.5 km 2 ) made it possible to detect sharp changes in vegetation activity following a devastating fire over a relatively large area. It is also possible to attribute observed increases in GOME-2A SIF to changes that occur much more slowly and on an even larger spatial scale, such as the reforestation efforts in northern China, but this requires the careful selection and co-sampling of explanatory biogeographical data such as soil moisture, temperature, and forest cover.
The code needed to co-sample spatiotemporal changes in SIF and in supporting data is available upon request from the first author.
All data used in this study are publicly available. The GOME-2 SIF data are provided by KNMI within the framework of the EUMETSAT Satellite Application Facility on Atmospheric Composition Monitoring (AC SAF). KNMI GOME-2A SIF data can be downloaded from https://doi.org/10.21944/gome2a-sifter-v2-sun-induced-fluorescence ( Kooreman et al. , 2020 ) .
The supplement related to this article is available online at: https://doi.org/10.5194/bg-21-2297-2024-supplement .
JCSA and KFB designed the study and led the writing. JCSA performed the data analysis. PS contributed to the interpretation of the results and to the review of all versions of the manuscript and figures. GK provided and conducted the analysis of the MODIS NIRv data over northern China. PK and CF contributed to the interpretation of the results of TROPOMI SIF over Australia. WW and JS provided the OzFlux data and contributed to the determination of the validity of SIF–GPP over Australia. All co-authors reviewed the paper.
The contact author has declared that none of the authors has any competing interests.
Publisher’s note: Copernicus Publications remains neutral with regard to jurisdictional claims made in the text, published maps, institutional affiliations, or any other geographical representation in this paper. While Copernicus Publications makes every effort to include appropriate place names, the final responsibility lies with the authors.
This work received funding from the European Union's Horizon 2020 research and innovations programme under grant agreement no. 869367 (EU LANDMARC project) and from the European Organization for the Exploitation of Meteorological Satellites (EUMETSAT) Atmospheric Composition Satellite Application Facility (AC-SAF). We acknowledge the free use of SIFTER sun-induced fluorescence data from the (GOME-2A) sensor from https://www.temis.nl , last access: 5 October 2022. Furthermore, we would like to thank LANDMARC colleagues Markus Donat from the Barcelona Supercomputing Center (BSC) for the discussion on intercomparison of SIF with climate variables and Moritz Laub from ETH Zürich for the discussion of the wildfire impact on the carbon cycle perturbation.
This research has been supported by the Horizon 2020 research and innovation programme (grant no. 869367) and the European Organization for the Exploitation of Meteorological Satellites (EUMETSAT) Atmospheric Composition Satellite Application Facility (AC-SAF).
This paper was edited by Anja Rammig and reviewed by two anonymous referees.
Ač, A., Malenovský, Z., Olejníčková, J., Gallé, A., Rascher, U., and Mohammed, G.: Meta-analysis assessing potential of steady-state chlorophyll fluorescence for remote sensing detection of plant water, temperature and nitrogen stress, Remote Sens. Environ., 168, 420–436, https://doi.org/10.1016/j.rse.2015.07.022 , 2015. a
Bacour, C., Maignan, F., MacBean, N., Porcar-Castell, A., Flexas, J., Frankenberg, C., Peylin, P., Chevallier, F., Vuichard, N., and Bastrikov, V.: Improving Estimates of Gross Primary Productivity by Assimilating Solar-Induced Fluorescence Satellite Retrievals in a Terrestrial Biosphere Model Using a Process-Based SIF Model, J. Geophys. Res.-Biogeo., 124, 3281–3306, https://doi.org/10.1029/2019JG005040 , 2019. a
Bowman, D. M., Williamson, G. J., Price, O. F., Ndalila, M. N., and Bradstock, R. A.: Australian forests, megafires and the risk of dwindling carbon stocks, Plant Cell Environ., 44, 347–355, https://doi.org/10.1111/pce.13916 , 2021. a
Brook, B. W., Ellis, E. C., Perring, M. P., Mackay, A. W., and Blomqvist, L.: Does the terrestrial biosphere have planetary tipping points?, Trend. Ecol. Evol., 28, 396–401, https://doi.org/10.1016/j.tree.2013.01.016 , 2013. a
Byrne, B., Liu, J., Yin, Y., and Bowman, K.: The carbon cycle of southeast Australia during 2019–2020: Drought, fires and subsequent recovery This manuscript is a preprint and has been submitted for publication as a, AGU Adv., 2, 1–31, 2021. a
Cao, S., Chen, L., and Yu, X.: Impact of China's Grain for Green Project on the landscape of vulnerable arid and semi-arid agricultural regions: A case study in northern Shaanxi Province, J. Appl. Ecol., 46, 536–543, https://doi.org/10.1111/j.1365-2664.2008.01605.x , 2009. a
Chu, X. X., Zhan, J., Li, Z., Zhang, F., and Qi, W.: Assessment on forest carbon sequestration in the Three-North Shelterbelt Program region, China, J. Clean. Prod., 215, 382–389, https://doi.org/10.1016/j.jclepro.2018.12.296 , 2019. a
Chungu, D., Ng'andwe, P., Mubanga, H., and Chileshe, F.: Fire alters the availability of soil nutrients and accelerates growth of Eucalyptus grandis in Zambia, J. Forestry Res., 31, 1637–1645, https://doi.org/10.1007/s11676-019-00977-y , 2020. a
Dechant, B., Ryu, Y., Badgley, G., Zeng, Y., Berry, J. A., Zhang, Y., Goulas, Y., Li, Z., Zhang, Q., Kang, M., Li, J., and Moya, I.: Canopy structure explains the relationship between photosynthesis and sun-induced chlorophyll fluorescence in crops, Remote Sens. Environ., 241, 111733, https://doi.org/10.1016/j.rse.2020.111733 , 2020. a
Delang, C. O. and Yuan, Z.: China's Grain for Green Program, Springer, ISBN 9783319115047, https://doi.org/10.1007/978-3-319-11505-4 , 2015. a
Dorigo, W., Preimesberger, W., Reimer, C., Van der Schalie, R., Pasik, A., De Jeu, R., and Paulik, C.: Soil moisture gridded data from 1978 to present, v201912.0.0., https://cds.climate.copernicus.eu/cdsapp#!/dataset/satellite-soil-moisture?tab=overview (last access: 2 September 2022), 2019. a
Doughty, R., Köhler, P., Frankenberg, C., Magney, T. S., Xiao, X., Qin, Y., Wu, X., and Moore, B.: TROPOMI reveals dry-season increase of solar-induced chlorophyll fluorescence in the Amazon forest, P. Natl. Acad. Sci. USA, 116, 22393–22398, https://doi.org/10.1073/pnas.1908157116 , 2019. a
Drusch, M., Moreno, J., Del Bello, U., Franco, R., Goulas, Y., Huth, A., Kraft, S., Middleton, E. M., Miglietta, F., Mohammed, G., Nedbal, L., Rascher, U., Schüttemeyer, D., and Verhoef, W.: The FLuorescence EXplorer Mission Concept – ESA's Earth Explorer 8, IEEE Trans. Geosci. Remote Sens., 55, 1273–1284, https://doi.org/10.1109/TGRS.2016.2621820 , 2016. a
Duffy, K. A., Schwalm, C. R., Arcus, V. L., Koch, G. W., Liang, L. L., and Schipper, L. A.: How close are we to the temperature tipping point of the terrestrial biosphere?, Sci. Adva., 7, 1–9, https://doi.org/10.1126/sciadv.aay1052 , 2021. a
Fancourt, M., Ziv, G., Boersma, K. F., Tavares, J., Wang, Y., and Galbraith, D.: Background climate conditions regulated the photosynthetic response of Amazon forests to the 2015/2016 El Nino-Southern Oscillation event, Commun. Earth Environ., 3, 1–9, https://doi.org/10.1038/s43247-022-00533-3 , 2022. a
Frankenberg, C. and Berry, J.: Solar induced chlorophyll fluorescence: Origins, relation to photosynthesis and retrieval, 1986, Elsevier, ISBN 9780128032206, https://doi.org/10.1016/B978-0-12-409548-9.10632-3 , 2017. a
Frankenberg, C., Fisher, J. B., Worden, J., Badgley, G., Saatchi, S. S., Lee, J. E., Toon, G. C., Butz, A., Jung, M., Kuze, A., and Yokota, T.: New global observations of the terrestrial carbon cycle from GOSAT: Patterns of plant fluorescence with gross primary productivity, Geophys. Res. Lett., 38, 1–6, https://doi.org/10.1029/2011GL048738 , 2011. a , b
Friedlingstein, P., O'Sullivan, M., Jones, M. W., Andrew, R. M., Hauck, J., Olsen, A., Peters, G. P., Peters, W., Pongratz, J., Sitch, S., Le Quéré, C., Canadell, J. G., Ciais, P., Jackson, R. B., Alin, S., Aragão, L. E. O. C., Arneth, A., Arora, V., Bates, N. R., Becker, M., Benoit-Cattin, A., Bittig, H. C., Bopp, L., Bultan, S., Chandra, N., Chevallier, F., Chini, L. P., Evans, W., Florentie, L., Forster, P. M., Gasser, T., Gehlen, M., Gilfillan, D., Gkritzalis, T., Gregor, L., Gruber, N., Harris, I., Hartung, K., Haverd, V., Houghton, R. A., Ilyina, T., Jain, A. K., Joetzjer, E., Kadono, K., Kato, E., Kitidis, V., Korsbakken, J. I., Landschützer, P., Lefèvre, N., Lenton, A., Lienert, S., Liu, Z., Lombardozzi, D., Marland, G., Metzl, N., Munro, D. R., Nabel, J. E. M. S., Nakaoka, S.-I., Niwa, Y., O'Brien, K., Ono, T., Palmer, P. I., Pierrot, D., Poulter, B., Resplandy, L., Robertson, E., Rödenbeck, C., Schwinger, J., Séférian, R., Skjelvan, I., Smith, A. J. P., Sutton, A. J., Tanhua, T., Tans, P. P., Tian, H., Tilbrook, B., van der Werf, G., Vuichard, N., Walker, A. P., Wanninkhof, R., Watson, A. J., Willis, D., Wiltshire, A. J., Yuan, W., Yue, X., and Zaehle, S.: Global Carbon Budget 2020, Earth Syst. Sci. Data, 12, 3269–3340, https://doi.org/10.5194/essd-12-3269-2020 , 2020. a
Gao, J., Jiao, K., and Wu, S.: Investigating the spatially heterogeneous relationships between climate factors and NDVI in China during 1982 to 2013, J. Geogr. Sci., 29, 1597–1609, https://doi.org/10.1007/s11442-019-1682-2 , 2019. a , b , c
Gerlein-Safdi, C., Keppel-Aleks, G., Wang, F., Frolking, S., and Mauzerall, D. L.: Satellite Monitoring of Natural Reforestation Efforts in China's Drylands, One Earth, 2, 98–108, https://doi.org/10.1016/j.oneear.2019.12.015 , 2020. a , b , c , d , e
Getachew Mengistu, A., Mengistu Tsidu, G., Koren, G., Kooreman, M. L., Folkert Boersma, K., Tagesson, T., Ardö, J., Nouvellon, Y., and Peters, W.: Sun-induced fluorescence and near-infrared reflectance of vegetation track the seasonal dynamics of gross primary production over Africa, Biogeosciences, 18, 2843–2857, https://doi.org/10.5194/bg-18-2843-2021 , 2021. a , b
Giglio, L., Justice, C., Boschetti, L., and Roy, D.: MCD64A1 MODIS/Terra + Aqua Burned Area Monthly L3 Global 500m SIN Grid V006, NASA EOSDIS Land Processes DAAC [data set], https://doi.org/10.5067/MODIS/MCD64A1.006 , 2015. a , b
Guanter, L., Zhang, Y., Jung, M., Joiner, J., Voigt, M., Berry, J. A., Frankenberg, C., Huete, A. R., Zarco-Tejada, P., Lee, J. E., Moran, M. S., Ponce-Campos, G., Beer, C., Camps-Valls, G., Buchmann, N., Gianelle, D., Klumpp, K., Cescatti, A., Baker, J. M., and Griffis, T. J.: Global and time-resolved monitoring of crop photosynthesis with chlorophyll fluorescence, P. Natl. Acad. Sci. USA, 111, E1327–E1333, https://doi.org/10.1073/pnas.1320008111 , 2014. a
Guo, M., Li, J., Yu, F., Yin, S., Huang, S., and Wen, L.: Estimation of post-fire vegetation recovery in boreal forests using solar-induced chlorophyll fluorescence (SIF) data, Int. J. Wildland Fire, 30, 365–377, https://doi.org/10.1071/WF20162 , 2021. a
Harper, A. B., Powell, T., Cox, P. M., House, J., Huntingford, C., Lenton, T. M., Sitch, S., Burke, E., Chadburn, S. E., Collins, W. J., Comyn-Platt, E., Daioglou, V., Doelman, J. C., Hayman, G., Robertson, E., van Vuuren, D., Wiltshire, A., Webber, C. P., Bastos, A., Boysen, L., Ciais, P., Devaraju, N., Jain, A. K., Krause, A., Poulter, B., and Shu, S.: Land-use emissions play a critical role in land-based mitigation for Paris climate targets, Nat. Commun., 9, 2938, https://doi.org/10.1038/s41467-018-05340-z , 2018. a
Huntzinger, D. N., Michalak, A. M., Schwalm, C., Ciais, P., King, A. W., Fang, Y., Schaefer, K., Wei, Y., Cook, R. B., Fisher, J. B., Hayes, D., Huang, M., Ito, A., Jain, A. K., Lei, H., Lu, C., Maignan, F., Mao, J., Parazoo, N., Peng, S., Poulter, B., Ricciuto, D., Shi, X., Tian, H., Wang, W., Zeng, N., and Zhao, F.: Uncertainty in the response of terrestrial carbon sink to environmental drivers undermines carbon-climate feedback predictions, Sci. Rep., 7, 1–8, https://doi.org/10.1038/s41598-017-03818-2 , 2017. a
Isaac, P., Cleverly, J., McHugh, I., Van Gorsel, E., Ewenz, C., and Beringer, J.: OzFlux data: Network integration from collection to curation, Biogeosciences, 14, 2903–2928, https://doi.org/10.5194/bg-14-2903-2017 , 2017. a
Joiner, J., Yoshida, Y., Vasilkov, A. P., Yoshida, Y., Corp, L. A., and Middleton, E. M.: First observations of global and seasonal terrestrial chlorophyll fluorescence from space, Biogeosciences, 8, 637–651, https://doi.org/10.5194/bg-8-637-2011 , 2011. a , b
Joiner, J., Guanter, L., Lindstrot, R., Voigt, M., Vasilkov, A. P., Middleton, E. M., Huemmrich, K. F., Yoshida, Y., and Frankenberg, C.: Global monitoring of terrestrial chlorophyll fluorescence from moderate-spectral-resolution near-infrared satellite measurements: methodology, simulations, and application to GOME-2, Atmos. Meas. Tech., 6, 2803–2823, https://doi.org/10.5194/amt-6-2803-2013 , 2013. a
Joiner, J., Yoshida, Y., Guanter, L., and Middleton, E. M.: New methods for the retrieval of chlorophyll red fluorescence from hyperspectral satellite instruments: Simulations and application to GOME-2 and SCIAMACHY, Atmos. Meas. Tech., 9, 3939–3967, https://doi.org/10.5194/amt-9-3939-2016 , 2016. a
Joiner, J., Yoshida, Y., Zhang, Y., Duveiller, G., Jung, M., Lyapustin, A., Wang, Y., and Tucker, C. J.: Estimation of terrestrial global gross primary production (GPP) with satellite data-driven models and eddy covariance flux data, Remote Sens., 10, 1–38, https://doi.org/10.3390/rs10091346 , 2018. a , b , c , d , e
Köhler, P., Frankenberg, C., Magney, T. S., Guanter, L., Joiner, J., and Landgraf, J.: Global Retrievals of Solar-Induced Chlorophyll Fluorescence With TROPOMI: First Results and Intersensor Comparison to OCO-2, Geophys. Res. Lett., 45, 10456–10463, https://doi.org/10.1029/2018GL079031 , 2018. a , b , c
Kong, Z. H., Stringer, L. C., Paavola, J., and Lu, Q.: Situating China in the global effort to combat desertification, Land, 10, 1–22, https://doi.org/10.3390/land10070702 , 2021. a
Kooreman, M. L., Boersma, K. F., van Schaik, E., van Versendaal, R., Cacciari, A., and Tuinder, O. N. E.: SIFTER sun-induced vegetation fluorescence data from GOME-2A (Version 2.0), Royal Netherlands Meteorological Institute (KNMI) [data set], https://doi.org/10.21944/gome2a-sifter-v2-sun-induced-fluorescence , 2020. a , b
Li, S., Yang, S., Liu, X., Liu, Y., and Shi, M.: NDVI-based analysis on the influence of climate change and human activities on vegetation restoration in the shaanxi-gansu-ningxia region, central China, Remote Sens., 7, 11163–11182, https://doi.org/10.3390/rs70911163 , 2015. a
Li, X. and Xiao, J.: TROPOMI observations allow for robust exploration of the relationship between solar-induced chlorophyll fluorescence and terrestrial gross primary production, Remote Sens. Environ., 268, 112748, https://doi.org/10.1016/j.rse.2021.112748 , 2022. a
Lin, X., Niu, J., Berndtsson, R., Yu, X., Zhang, L., and Chen, X.: Ndvi dynamics and its response to climate change and reforestation in Northern China, Remote Sens., 12, 1–15, https://doi.org/10.3390/rs12244138 , 2020. a , b , c
Lindenmayer, D. B. and Taylor, C.: New spatial analyses of Australian wildfires highlight the need for new fire, resource, and conservation policies, P. Natl. Acad. Sci. USA, 117, 12481–12485, https://doi.org/10.1073/pnas.2002269117 , 2020. a
Liu, L., Guan, L., and Liu, X.: Directly estimating diurnal changes in GPP for C 3 and C 4 crops using far-red sun-induced chlorophyll fluorescence, Agr. Forest Meteorol., 232, 1–9, https://doi.org/10.1016/j.agrformet.2016.06.014 , 2017. a
Lymburner, L., Tan, P., McIntyre, A., Tankappan, M., and Sixsmith, J.: Dynamic Land Cover Dataset Version 2.1 [data set], https://pid.geoscience.gov.au/dataset/ga/83868 (last access: 30 September 2021), 2015. a
Madani, N., Parazoo, N. C., Kimball, J. S., Reichle, R. H., Chatterjee, A., Watts, J. D., Saatchi, S., Liu, Z., Endsley, A., Tagesson, T., Rogers, B. M., Xu, L., Wang, J. A., Magney, T., and Miller, C. E.: The Impacts of Climate and Wildfire on Ecosystem Gross Primary Productivity in Alaska, J. Geophys. Res.-Biogeo., 126, 1–14, https://doi.org/10.1029/2020JG006078 , 2021. a
Magney, T. S., Bowling, D. R., Logan, B. A., Grossmann, K., Stutz, J., Blanken, P. D., Burns, S. P., Cheng, R., Garcia, M. A., Köhler, P., Lopez, S., Parazoo, N. C., Raczka, B., Schimel, D., and Frankenberg, C.: Mechanistic evidence for tracking the seasonality of photosynthesis with solar-induced fluorescence, P. Natl. Acad. Sci. USA, 116, 11640–11645, https://doi.org/10.1073/pnas.1900278116 , 2019. a , b
Moene, A. F. and Van Dam, J. C.: Transport in the atmosphere-vegetation-soil continuum, Cambridge University Press, https://doi.org/10.1017/CBO9781139043137 , 2014. a
Monteith, J.: Solar Radiation And Productivity in Tropical Ecosystems, Society, 9, 747–766, 1972. a
Muñoz Sabater, J.: ERA5-Land hourly data from 1950 to present, Copernicus Climate Change Service (C3S) Climate Data Store (CDS) [date set], https://doi.org/10.24381/cds.e2161bac (last access: 1 September 2022), 2019. a
Porcar-Castell, A., Tyystjärvi, E., Atherton, J., Van Der Tol, C., Flexas, J., Pfündel, E. E., Moreno, J., Frankenberg, C., and Berry, J. A.: Linking chlorophyll a fluorescence to photosynthesis for remote sensing applications: Mechanisms and challenges, J. Exp. Bot., 65, 4065–4095, https://doi.org/10.1093/jxb/eru191 , 2014. a
Qu, S., Wang, L., Lin, A., Yu, D., Yuan, M., and Li, C.: Distinguishing the impacts of climate change and anthropogenic factors on vegetation dynamics in the Yangtze River Basin, China, Ecol. Indic., 108, 105724, https://doi.org/10.1016/j.ecolind.2019.105724 , 2020. a
Rogelj, J., Shindell, D., Jiang, K., Fifita, S., Forster, P., Ginzburg, V., Handa, C., Kheshgi, H., Kobayashi, S., Kriegler, E., Mundaca, L., Séférian, R., and Vilariño, M.: Mitigation Pathways Compatible with 1.5 °C in the Context of Sustainable Development. In: Global Warming of 1.5 °C, An IPCC Special Report on the impacts of global warming of 1.5 °C above pre-industrial levels and related global greenhouse gas emission pathw, IPCC special report Global Warming of 1.5 °C, 82 pp., https://www.ipcc.ch/site/assets/uploads/sites/2/2019/02/SR15_Chapter2_Low_Res.pdf (last access: 16 Juni 2023), 2018. a
Schimel, D., Stephens, B. B., and Fisher, J. B.: Effect of increasing CO 2 on the terrestrial carbon cycle, P. Natl. Acad. Sci. USA, 112, 436–441, https://doi.org/10.1073/pnas.1407302112 , 2015. a
Schurgers, G., Ahlström, A., Arneth, A., Pugh, T. A., and Smith, B.: Climate Sensitivity Controls Uncertainty in Future Terrestrial Carbon Sink, Geophys. Res. Lett., 45, 4329–4336, https://doi.org/10.1029/2018GL077528 , 2018. a
Smith, W. K., Fox, A. M., MacBean, N., Moore, D. J., and Parazoo, N. C.: Constraining estimates of terrestrial carbon uptake: new opportunities using long-term satellite observations and data assimilation, New Phytol., 225, 105–112, https://doi.org/10.1111/nph.16055 , 2020. a
Song, L., Guanter, L., Guan, K., You, L., Huete, A., Ju, W., and Zhang, Y.: Satellite sun-induced chlorophyll fluorescence detects early response of winter wheat to heat stress in the Indian Indo-Gangetic Plains, Glob. Change Biol., 24, 4023–4037, https://doi.org/10.1111/gcb.14302 , 2018. a
Stol, J. and Kitchen, M.: Tumbarumba Flux Data Release 2022_v1 (Version 1.0), Terrestrial Ecosystem Research Network [data set], https://doi.org/10.25901/esrb-5609 , 2022. a , b
Sun, H., Wang, J., Xiong, J., Bian, J., Jin, H., Cheng, W., and Li, A.: Vegetation Change and Its Response to Climate Change in Yunnan Province, China, Adv. Meteorol., 2021, 8857589, https://doi.org/10.1155/2021/8857589 , 2021. a
Sun, W., Song, X., Mu, X., Gao, P., Wang, F., and Zhao, G.: Spatiotemporal vegetation cover variations associated with climate change and ecological restoration in the Loess Plateau, Agr. Forest Meteorol., 209/210, 87–99, https://doi.org/10.1016/j.agrformet.2015.05.002 , 2015. a
Sun, Y., Frankenberg, C., Jung, M., Joiner, J., Guanter, L., Köhler, P., and Magney, T.: Overview of Solar-Induced chlorophyll Fluorescence (SIF) from the Orbiting Carbon Observatory-2: Retrieval, cross-mission comparison, and global monitoring for GPP, Remote Sens. Environ., 209, 808–823, https://doi.org/10.1016/j.rse.2018.02.016 , 2018. a
Turner, A. J., Köhler, P., Magney, T. S., Frankenberg, C., Fung, I., and Cohen, R. C.: Extreme events driving year-to-year differences in gross primary productivity across the US, Biogeosciences, 18, 6579–6588, https://doi.org/10.5194/bg-18-6579-2021 , 2021. a , b
Turner, A. J., Köhler, P., Magney, T. S., Frankenberg, C., Fung, I., and Cohen, R. C.: A double peak in the seasonality of California's photosynthesis as observed from space, Biogeosciences, 17, 405–422, https://doi.org/10.5194/bg-17-405-2020 , 2020. a
United Nations: Conference of the Parties Twenty – second session Marrakech, 7–18 November 2016 Item X of the provisional agenda, Aggregate effect of the intended nationally determined contributions: an update, 07126, 16–7126, http://unfccc.int/resource/docs/2016/cop22/eng/02.pdf (last access: 16 Juni 2023), 2016. a
Van Schaik, E., Kooreman, M. L., Stammes, P., Gijsbert Tilstra, L., Tuinder, O. N., Sanders, A. F., Verstraeten, W. W., Lang, R., Cacciari, A., Joiner, J., Peters, W., and Folkert Boersma, K.: Improved SIFTER v2 algorithm for long-term GOME-2A satellite retrievals of fluorescence with a correction for instrument degradation, Atmos. Meas. Techn., 13, 4295–4315, https://doi.org/10.5194/amt-13-4295-2020 , 2020. a , b , c , d , e , f , g
Veefkind, J. P., Aben, I., McMullan, K., Förster, H., de Vries, J., Otter, G., Claas, J., Eskes, H. J., de Haan, J. F., Kleipool, Q., van Weele, M., Hasekamp, O., Hoogeveen, R., Landgraf, J., Snel, R., Tol, P., Ingmann, P., Voors, R., Kruizinga, B., Vink, R., Visser, H., and Levelt, P. F.: TROPOMI on the ESA Sentinel-5 Precursor: A GMES mission for global observations of the atmospheric composition for climate, air quality and ozone layer applications, Remote Sens. Environ., 120, 70–83, https://doi.org/10.1016/j.rse.2011.09.027 , 2012. a
Verma, M., Schimel, D., Evans, B., Frankenberg, C., Beringer, J., Drewry, D. T., Magney, T., Marang, I., Hutley, L., Moore, C., and Eldering, A.: Effect of environmental conditions on the relationship between solar-induced fluorescence and gross primary productivity at an OzFlux grassland site, J. Geophys. Res.-Biogeo., 122, 716–733, https://doi.org/10.1002/2016JG003580 , 2017. a
Wang, S., Zhang, Y., Ju, W., Porcar-Castell, A., Ye, S., Zhang, Z., Brümmer, C., Urbaniak, M., Mammarella, I., Juszczak, R., and Folkert Boersma, K.: Warmer spring alleviated the impacts of 2018 European summer heatwave and drought on vegetation photosynthesis, Agr. Forest Meteorol., 295, 108195, https://doi.org/10.1016/j.agrformet.2020.108195 , 2020. a
Wang, S., Li, R., Wu, Y., and Zhao, S.: Effects of multi-temporal scale drought on vegetation dynamics in Inner Mongolia from 1982 to 2015, China, Ecol. Indic., 136, 108666, https://doi.org/10.1016/j.ecolind.2022.108666 , 2022. a
Yang, J. and Huang, X.: The 30 m annual land cover dataset and its dynamics in China from 1990 to 2019, Earth Syst. Sci. Data, 13, 3907–3925, https://doi.org/10.5194/essd-13-3907-2021 , 2021. a , b , c
Zhang, L. and Schwärzel, K.: China's land resources dilemma: Problems, outcomes, and options for sustainable land restoration, Sustainability, 9, 2362, https://doi.org/10.3390/su9122362 , 2017. a
Zhang, W., Wei, F., Horion, S., Fensholt, R., Forkel, M., and Brandt, M.: Global quantification of the bidirectional dependency between soil moisture and vegetation productivity, Agr. Forest Meteorol., 313, 108735, https://doi.org/10.1016/j.agrformet.2021.108735 , 2022. a
Zhang, Y. and Ye, A.: Quantitatively distinguishing the impact of climate change and human activities on vegetation in mainland China with the improved residual method, GISci. Remote Sens., 58, 235–260, https://doi.org/10.1080/15481603.2021.1872244 , 2021. a
- Introduction
- Forest loss following the eucalyptus fire in southeast Australia
- Reforestation in north-central China
- Conclusions and discussion
- Code availability
- Data availability
- Author contributions
- Competing interests
- Acknowledgements
- Financial support
- Review statement

Nature of Home
10 Aggressive Dog Breeds & The Study That Changes Everything
Posted: May 14, 2024 | Last updated: May 14, 2024

Are there really aggressive dog breeds?
According to a University of Bristol study 1 , it’s more likely the case of aggressive dog owners than aggressive breeds. The study found a dog’s aggression relates more to characteristics of the owner, like age and training methods, than the breed itself.
Dogs owned by people under 25 were nearly twice as likely to be aggressive compared to those with owners over 40. Positive training reduced aggression towards strangers by 50%, but using punishments and negative reinforcement significantly increased aggressive behaviors.
But unfortunately, there have been reports that certain breeds are disproportionately involved in attacks on humans. According to research 2 , here are the dog breeds that are frequently associated with serious attacks:

1. Pit Bulls: The Controversial Canine
Pit Bulls have long been the subject of heated debates regarding their temperament. According to a 2015 study, Pit Bulls were responsible for 82% of dog-bite related fatalities in the U.S., despite making up only 6.6% of the dog population. ( ref )
But many argue that these statistics are skewed due to the breed’s popularity among irresponsible owners who encourage aggressive behavior.
With proper training and socialization, Pit Bulls can be loving and loyal companions. It’s crucial for potential owners to understand the breed’s needs and to provide a stable, nurturing environment.

2. Rottweilers: Powerful and Protective
Rottweilers, known for their strength and loyalty, have also been involved in a significant number of fatal attacks. In 2015, Rottweilers were the second most lethal dog breed, and together with Pit Bulls, they accounted for 91% of dog bite fatalities in the U.S.
As with any large, powerful breed, Rottweilers require consistent training and socialization from an early age.

3. German Shepherds: Intelligent & Intense
German Shepherds are highly intelligent and often used as police and military dogs due to their trainability and loyalty. But their protective nature and potential for aggression towards strangers can make them dangerous if not properly trained.
Early socialization and obedience training are essential for German Shepherds (check out these German commands ) to ensure they are well-behaved and can distinguish between real threats and harmless situations.

4. Doberman Pinschers: Sleek & Strong
Doberman Pinschers are known for their elegance and intelligence, but they have also been involved in several attacks. Most of these incidents occur when the dog is protecting its owner or property.

5. Bullmastiffs: Gentle Giants with a Bite
Weighing up to 130 pounds, Bullmastiffs are imposing dogs that were originally bred as guard dogs. Their size and strength enable them to inflict serious harm if they feel threatened or provoked. Proper training is crucial to prevent aggressive behavior.
Despite their intimidating appearance, Bullmastiffs can be gentle and affectionate with their families. They require an experienced owner who can provide firm leadership and plenty of socialization.

6. Siberian Huskies: Beautiful but Unpredictable
Siberian Huskies are striking dogs known for their wolf-like appearance and piercing blue eyes. While they may look cuddly, they are not always very social unless raised to be.
Huskies have a high prey drive and require plenty of exercise and mental stimulation.

7. Alaskan Malamutes: Powerful Sled Dogs
Alaskan Malamutes, originally bred for pulling sleds, are strong, independent dogs with a high prey drive. They can be aggressive towards other dogs, which can result in injury to the other dog’s owner or nearby children. They are not well-suited for apartment living or novice owners.

8. Chow Chows: Fluffy but Fierce
Chow Chows, with their teddy bear-like appearance, may seem like cuddly companions, but they were originally developed in Mongolia and have been known to have aggressive tendencies. Early socialization and training are essential to prevent territorial or aggressive behavior.

9. St. Bernards: Massive & Mighty
St. Bernards are massive dogs that can weigh up to 260 pounds. While they are often portrayed as gentle giants, their size and strength can make their bites lethal if they feel threatened or provoked.

10. Great Danes: Towering & Temperamental
As with any large breed , Great Danes require an owner who can provide plenty of space, exercise, and consistent training. They can be gentle and loving family pets when raised in a responsible and nurturing environment.

The Human Connection
Aggressive owners may gravitate towards particular breeds, perpetuating a cycle through improper training methods like punishment which can increase aggression up to three-fold, according to the RSPCA ( ref ).
The organization emphasizes that aggression in dogs often stems from:
- Learned behaviors
…that they have picked up from their owners. They also advocate that dogs should not be declared dangerous based solely on their breed or appearance. Each dog should be assessed based on their actual behavior.

Breed Tendencies vs. Individual Behavior
While certain breeds may be over-represented in bite statistics due to their guarding backgrounds, a dog’s likelihood of aggressive or dangerous behavior depends heavily on the owner’s age, experience, training methods and commitment to proper socialization.
Responsible ownership focused on positive reinforcement training is crucial for minimizing risk, regardless of breed.
Making assumptions about aggression based solely on a dog’s breed is inappropriate, as their behavior is a complex product of situational factors, genetics and their unique history with their owner.
- https://www.smithsonianmag.com/smart-news/owners-not-breeds-predict-whether-dog-will-be-aggressive-180949962/
- https://www.dogsbite.org/reports/13-years-us-dog-bite-fatalities-2005-2017-dogsbite.pdf
More for You
Harvard psychologist: If you say 'yes' to any of these 9 questions, you're 'more emotionally secure than most'
If You See Black Residue on Your Cast-Iron Skillet, This Is What It Means
11 Plants That Repel and Keep Rabbits Out of Your Yard
Fever Coach Christie Sides Addresses Caitlin Clark's Rough WNBA Debut
68 Amazingly Quick Dinners To Make Busy Weeknights A Breeze
5 Things Good Leaders Do That Bad Managers Don't (or Won't)
46% of divorced couples say this was the No. 1 conflict in their relationship—and it isn't money
Iran and the Houthis have defeated the US military
Is Costco Rotisserie Chicken Healthy?
Angel Reese's frustration boils over as Chicago Sky fly commercial, while Caitlin Clark and Fever fly charter
3 underrated shows on (HBO) Max you need to watch in May
The Weirdest and Most Unusual Buildings in Every State
I moved to Europe thinking living and working there would be a dream come true. I wasn't prepared for the loneliness.
Comcast announces Netflix, AppleTV, Peacock bundle at ‘vastly reduced’ price
The Case is Pretty Much Over: Akerman on Trump Trial
76 Ways to Cook Elbow Macaroni
Frank Gore Jr says 'no way 257 players' were better prospects after going undrafted
10 High-Fiber Snack Bars to Help You Stay Full
The longest-running shows in the history of television
"I just laugh. That's all I can do" - Anthony Edwards on Nikola Jokic's dominant performance in Game 5
IMAGES
COMMENTS
This case study was done to enhance my learning experience and challenge myself to redesign it to serve a specific purpose. WHAT IS FORBES? Forbes is an American media and publishing company that provides daily news coverage on business, technology, financial markets, lifestyle, and a wide array of other topics.
In this case study, I want to explore how we can give the app a more user-centric redesign, focusing on better navigation, tidier organization, and more engaging video interactions. 🚀. The end goal? To make the learning journey smooth for students. 🎓. Goals. Improve overall user experience. Enhance the app's organization and navigation.
Then the UX designer must determine how to improve upon the prior design while avoiding changes that are so radical that they confuse and frustrate the product's existing users. It's a tough balancing act that requires attention to detail and a deep understanding of users' goals. 2. Reasons to conduct a redesign.
The Postmates redesign works as a great UX case study for the simple way it approaches problem-solving. Following an overview of the work, it addresses the problems faced by users of the app. It then establishes research processes and highlights how changes were made to reduce these issues. 4. TV Guide
Maria Dzhoholyk. 24 217. Union Bank Mobile App Redesign - UX Case Study. Lawal Ayodeji. 39 155. Klacify mobile app UI. Rufai Quadri. 5 27. Behance is the world's largest creative network for showcasing and discovering creative work.
Show off some initial concepts of your redesign using screenshots & video (if your case study is online). Here is where you would show off the most important pages of your redesign. Provide the name of the page, a bulleted list of improvements compared to your base application, and a brief description of the purpose of the page.
UI/UX Case Study — IKEA Application Redesign. This case study is a final project for UI/UX Course at Dibimbing.id Bootcamp. So, this case study is not affiliated with or endorsed by IKEA. The ...
Rafiji app - UI/UX redesign case study. Multiple Owners. 2k 47k. IRCTC- Redesign: UI/UX Case Study. Parvati Doddur. 23 160. Instantly - Complete Rebranding of SaaS Business. Multiple Owners. 43 484.
Continuos product feedback and CSAT will help understand the shift that the product has acquired and understood to what extent the new redesign is helping users achieve their goals. Change aversion. Users generally get frustrated with the new design only on the following factors: When it involves a lot of learnability.
Case Study: Redesign an App Challenge. The given briefing was to work on the redesign of an app and we had to do two things: first, reproduce the existing screens because each redesign, no matter how small or big, always begins with an audit of the existing design. Second, redesign the app's look and feel.
A transportation app redesign case study: Miquido perspective. As the subject of this case study, we've chosen a popular transportation app that enables mobile payments for public transport and parking. However, it's not about the brand names - it's about the process, so we'll be keeping things neutral. Our research is focused on ...
UI/UX Case Study: Shopee Redesign. Mixed languages (English and Bahasa Indonesia) This case study was first written on Google Slides in early March 2022, however, I relocated it to Medium in early ...
UI/UX Case Study: Yummly App Redesign. Yummly is a well-known recipe and cooking app that offers users a variety of features to aid in finding, saving, and preparing recipes. It is made to ...
3) Know your limits but be creative. A real redesign case requires a lot of studies, research, user testing, and alignment with company goals. You probably won't have this level of detail, research, and data within a case study. However, seek out information and conduct research that is within your reach.
Case study: Instagram app redesign. I nstagram is a social media platform that has become integral to our lives. With over a billion monthly active users, it's one of the most popular apps in the world. However, as the app has evolved, some users have found the user interface outdated and clunky. My goal for this project was to redesign a ...
Product Redesign Examples: App Redesign UX/UI Case Study 2. One of the most popular music streaming apps around, Spotify, is consistently updating and refreshing its menus and feature layouts to target specific design problems. These updates are intended to provide a far more streamlined and intuitive flow that is also easy on the eye.
Case Studies in Design is a new effort to create opportunities for community and design leaders to think together about ways to catalyze transformational design, planning, and place-keeping from the ground up. The goals are to learn from ambitious projects designed in community, to share knowledge and experience through dialogue and a public library of case studies, and to train ourselves for ...
Para leer este comunicado en español, haga clic aquí The Budget Proposal — Covering Two Years — Cuts Spending, Makes Government Leaner, and Preserves Core Services Without New Taxes on Hardworking…
Case study: Redesigning the user dashboard. I worked as a UI/UX intern at andwemet.com for a period of six months in 2021. This was my first UI/UX intern, and to say I learn a lot would be an understatement. Being a fairly new startup, the team was very small with 4-5 team members. It was a platform revamp project for me, where I was the ...
Abstract. Reliable and robust monitoring tools are crucial to assess the effectiveness of land mitigation techniques (LMTs) in enhancing carbon uptake, enabling informed decision making by policymakers. This study, addressing one of the scientific goals of the EU Horizon 2020 Land Use Based Mitigation for Resilient Climate Pathways (LANDMARC) project, examines the feasibility of using ...
Case study: Redesign of Kotak Banking Application. Role: UX Researcher, UI Designer, Interaction Designer. 6 min read ...
8. Chow Chows: Fluffy but Fierce. Chow Chows, with their teddy bear-like appearance, may seem like cuddly companions, but they were originally developed in Mongolia and have been known to have ...
The views from this case study are strictly my own and I took a heuristic approach to redesign the Rapido app. This case study isn't exhaustive, as I didn't have full access to the user data of the application. Hence, I am certainly not suggesting that Rapido must endorse into my redesign. This is my attempt to improve my design aptitude by ...
Achieving the goal of integrated urban-rural development is to achieve a spatially balanced development of the constituent elements of urban-rural relations in China. Rural populations and land dedicated to construction are the main components of the countryside in traditional agricultural areas; they play an important role in the development of the countryside itself in terms of urban and ...