Students Use Graphic Organizers to Improve Mathematical Problem-Solving Communications
By: Alan Zollman
“Let me give you a math story problem.” This sentence often strikes fear in many middle grades students as well as some teachers. As international comparisons, national commissions, and state assessment results confirm, students have difficulty solving mathematical applications problems (Lester, 2007; U. S. Department of Education Institute of Educational Science, 2007; TIMMS, 2003; McREL, 2002; National Research Council, 2002; Illinois State Board of Education, 1997).
Improving students’ problem-solving abilities is a major, if not the major, goal of middle grades mathematics (National Council of Teachers of Mathematics, 2000; 1995; 1989). To address this goal, the author, who is a university mathematics educator, and nine inner-city middle school teachers developed a math/science action research project. This article describes our unique approach to mathematical problem solving derived from research on reading and writing pedagogy, specifically, research indicating that students who use graphic organizers to organize their ideas improve their comprehension and communication skills (Goeden, 2002 ; National Reading Panel, 2000).
Many teachers and students use graphic organizers to enhance the writing process in all subject areas, including mathematics. Graphic organizers help students organize and then clarify their thoughts, infer solutions to problems, and communicate their thinking strategies.
We designed a classroom action research project to study a problem-solving instructional approach in which students used graphic organizers. Our goal was to improve student achievement in three areas of our state’s math assessment in open-response problems: mathematics knowledge, strategic knowledge, and mathematical explanation. In this article, we discuss graphic organizers and their potential benefits for both students and teachers, we describe the specific graphic organizer adaptations we created for mathematical problem solving, and we discuss some of our research results of using the four corners and a diamond graphic organizer.
Benefits of using graphic organizers in mathematics learning
A graphic organizer is an instructional tool students can use to organize and structure information and concepts and to promote thinking about relationships between concepts. Furthermore, the spatial arrangement of a graphic organizer allows the student, and the teacher, to identify missing information or absent connections in one’s strategic thinking (Ellis, 2004).
Middle grades teachers already use many different types of graphic organizers in the writing process. All share the common trait of depicting the process of thinking into a pictorial or graphic format. This helps students reduce and organize information, concepts, and relationships. When a student completes a graphic organizer, he or she does not have to process as much specific, semantic information to understand the information or problem (Ellis, 2004). Graphic organizers allow, and often require, the student to sort information and classify it as essential or non-essential; structure information and concepts; identify relationships between concepts; and organize communication about an issue or problem.
Consider the middle grades math problem in Example 1 from a recent state assessment.

How many vertices (corners) are there in 1, 2, 3, 4, 5, 6 … n squares when they are arranged in the following way?
What did you first think when reading the problem? Did you first think of the meaning of the term “vertices” or that this is a mathematical pattern problem? Did you first think of counting the corners or that this looks like an arrangement of tables? Did you first think to discuss in your solution why you are not just adding four with every square? Did you first try to think of the singular form of the word vertices?
Initial thinking is not a linear activity, especially in mathematical problem solving. Yet, the result of problem solving—the written solution—often looks like a linear, step-by-step procedure. Good problem solvers brainstorm different thoughts and ideas when first presented with a problem, and these may or may not be useful. Problem solvers can use a graphic organizer to record random information but not process it. A student can later reflect upon usefulness of the information and ideas. If the information and ideas help the student make relationships between concepts, then they are essential. A graphic organizer allows a student to quickly organize, analyze, and synthesize one’s knowledge, concepts, relationships, strategy, and communication. It also gives every student a starting point for the problem-solving process.
Adapting a graphic organizer for mathematical problem solving
Figure 1: Four Corners and a diamond mathematics graphic organizer
Figure 1 depicts the four corners and a diamond graphic organizer. This graphic organizer was modified from the four squares writing graphic organizer described by Gould and Gould (1999). The four square writing method is a formulaic writing approach, originally designed to teach essay writing to children in a five paragraph, step-by-step approach. The graphic organizer portion of the method specifically assists students with prewriting and organizing. We saw beneficial problem-solving aspects in the graphic organizer portion of this writing method for mathematics.
Our four corners and a diamond graphic organizer has five areas:
- What do you need to find?
- What do you already know?
- Brainstorm possible ways to solve this problem.
- Try your ways here.
- What things do you need to include in your response? What mathematics did you learn by working this problem?
Actually, the form in Figure 1 does not have to be given to the students each time. Figure 2 shows how students, using a blank piece of paper, make the four corners and a diamond graphic organizer template. The student folds the paper into fourths, first folding the paper horizontally (“hot dog style”), then vertically (“hamburger style”), and finally the inner corner is folded up. When the paper is unfolded, the creases form the four corners and the “diamond” rhombus in the middle. The teachers reported that students later (e.g., during state testing) often folded or drew the five areas on their paper to begin problem solving.
Figure 2: Four Corners and a diamond folding template
So how does the use of the four corners and a diamond graphic organizer differ from the traditional Polya’s four-step mathematical problem-solving hierarchy? In terms of objectives, it does not. Obviously, the four corners and a diamond graphic organizer is designed to help students understand the problem, devise a plan, carry out the plan, and look back (Polya, 1944). However, by having the non-linear layout of the graphic organizer, the student is not expected to do these “steps” in a hierarchical, procedural order that some students misapply. It is the implementation process, how students form their response, that is the important aspect of the four corners and a diamond graphic organizer (Zollman, 2006a).
The pictorial orientation allows students to record their ideas in whatever order they occur. If students first think of the unit for their final answer, then this is recorded in the fifth, bottom-right area. This idea (the unit), then, is not needed in the short-term memory because a reminder is recorded. If students first think of a possible procedure for their answer, this is recorded in the third, upper-right area. The four corners and a diamond graphic organizer allows, and even encourages, students to use their problem-solving strategies in a non-hierarchical order. A student can work in one area of the organizer and later work a different area. It also shows that completing a problem-solving response has several different, but related, aspects.
Students do not begin writing a response until some information or ideas are in all five areas. The four corners and a diamond graphic organizer especially encourages students to begin working on a problem before they have an identified solution method. As in the four square writing method, the students then organize and edit their thoughts by writing their solution in the traditional linear response, using connecting phrases and adding details and relationships. The steps for the open response write-up are as follows: (1) state the problem; (2) list the given information; (3) explain methods for solving the problem; (4) identify mathematical work procedures; and (5) specify the final answer and conclusions.
The graphic portion of the organizer allows all students to fill in parts of the solution process. It encourages all students to persevere—to “muck around” working on a problem. Further, teachers quickly can identify where students are confused when solving a problem by simply examining the graphic organizer.
The teacher should model proper use of the four corners and a diamond graphic organizer and have students work in groups when introducing this tool. Working in groups allows students to see that many problems can be worked in more than one way and that different people start in different places when solving a problem. In their small-group discussions, students identify relationships between the areas in the graphic organizer and among the various solutions.

Four corners and a diamond provides students with a logical framework for writing about problem-solving tasks.
Graphic organizers can benefit students when they take standardized state mathematics assessments, specifically open-response problem-solving items. Most states use a scoring rubric for these types of items. In Illinois, for example, the scoring rubric has three categories: mathematical knowledge, strategic knowledge, and explanation (Illinois State Board of Education, 2005). Responses are scored on a four-point scale for each category, with scores ranging from zero for “no attempt” to four for “complete.” Typically, low-ability students do not attempt to show any work in one or more response categories, while average-ability students often have disorganized responses. Higher-ability students sometimes skip steps in their explanations. The four corners and a diamond graphic organizer helps each type of student produce a more complete response in each of the three categories and, thus, receive a higher score.
Impact of graphic organizers
Nine middle school teachers decided to use the open-response mathematics questions as the focus of their action research on the effects of using graphic organizers. Teachers administered pre- and post-tests with their students to see if using the four corners and a diamond graphic organizer impacted their performance.
All teachers reported dramatic improvements in students’ mathematics scores on open-response items after implementing the four corners and a diamond graphic organizer. The percentage of students (N=186) who scored at the “meets” or “exceeds” levels on each of the open-response item categories on the pre-test was 4% for math knowledge, 19% for strategic knowledge, and 8% for explanation. After instructing students to use the graphic organizer in mathematical problem solving, the percentage of students scoring “meets” or “exceeds” on the post-test improved to 75% for math knowledge, 68% for strategic knowledge, and 68% for explanation (Zollman, 2006a; 2006b).
Each teacher self-collected and self-scored these data using the state’s scoring rubric. Overall scores increased from a 27% average on the pre-test to a 70% average on the post-test. Data collected, analyzed, and triangulated from three sources—the teachers, the action research pre- and post-test data, and the students’ work—suggests that the use of the graphic organizer in mathematical problem solving may significantly help students coordinate their mathematical ideas, methods, thinking, and writing. The graphic organizer helped students coordinate various parts of mathematical problem solving: (a) What is the question? (b) What information is known? (c) What strategies might be used? (d) Which operations, procedures, or algorithms of the strategy need to be shown? (e) What explanations and reflections are needed to communicate the method(s) of solution? (Zollman, 2006a; 2006b).

Graphic organizers help students communicate their thinking when they solve problems.
The teachers found the use of graphic organizers in mathematical problem solving to be very efficient and effective for all levels of students. The teachers saw that their lower-ability students, who normally would not have attempted problems, had now written partial solutions. The organizer appeared to help average-ability students organize thinking strategies and help high-ability students improve their problem-solving communication skills (Zollman, 2006b). Students now had an efficient and familiar method for writing and communicating their thinking in a logical argument.
Samples of students’ work
The samples of student work in Figures 3 and 4 are from an open-response squares and vertices problem before and after the use of graphic organizers in the classroom.
Figure 3: Samples 1 & 2
Sample 1 shows the work of a student who was presented the problem before becoming familiar with the four corners and a diamond graphic organizer. Sample 2 shows the same student’s work later in the semester, after learning how to problem solve using the graphic organizer. The student’s strategy on the pre-test was to count the individual vertices in the picture, then add these numbers. This work shows a misunderstanding of the problem, limited strategy, and no explanation. On the post-test, this same student’s work shows a complete understanding of the problem presented (10 squares) and a complete explanation of a correct strategy that will transfer to other problems, however, it lacks a concluding algebraic formula to demonstrate mathematical knowledge. While it is not a perfect response, understanding, organization, development, and reflection are all strongly represented on the graphic organizer.
Figure 4: Samples 3, 4 & 5
The second student’s pre-test (Sample 3) shows the common incorrect strategy of just counting the total vertices in the picture. It appears that the student then attempted to “add” the individual pictures in the student’s own drawing to again count the vertices. However, without any explanation, the teacher cannot know what strategy, if any, the student was attempting. Again, this work shows a misunderstanding of the problem, limited strategy, and no explanation. This student’s post-test (Sample 4) illustrates excellent understanding, organization, development and reflection of the problem presented (10 squares). The graphic organizer shows the student’s complete, correct strategy, solution, and explanation of the problem. For mathematical knowledge, the formula is well explained in words, not as an algebraic expression. This would be acceptable on state assessments, as the problem did not specifically ask for an algebraic expression.
Sample 5 is the post-test work of a higher-ability student. This student’s work demonstrates a full understanding of the problem, a correct solution, and a complete explanation. The drawings also suggest that the student feels a sense of ownership of and satisfaction with the solution and probably finished the problem with plenty of time to spare.
We hoped the students in our action research study would improve their problem solving with an instructional intervention from pre-test to post-test; however, no single instructional method directly affects learning. Rather, instruction is one of many factors that may influence learning. Others include the curriculum, the student, the class, and the teacher. Nevertheless, the teachers who conducted the action research described in this article believed the graphic organizer was associated with many of the positive outcomes in their students’problem-solving ability (Zollman, 2006b).
The crucial factor in the effectiveness of any instructional method is how it is implemented. If four corners and a diamond graphic organizer is used as a linear, systematic procedure to teach problem solving, it will succeed sporadically. In fact, any direct teaching about problem solving is likely to have intermittent success. Giving students a chart of Polya’s (1944) four steps in problem solving or a graphic organizer sheet may help students learn the steps of problem solving. However, students may remain uncertain about where to start a problem, confused by essential versus non-essential information, or unaware how to communicate important steps and reflections in their solutions. We found that graphic organizers aid students in all three of these areas.
Allowing students to first use their own thinking–and then reflect, revise, and re-organize their knowledge, strategies, and communication–helps them improve their problem-solving abilities. Initially, teaching about problem solving as a hierarchy of procedural steps is neither efficient nor effective. Our results confirm other studies that found teaching via problem solving is the key instructional process (Lester, 2007).
As our work suggests, effective reading and writing strategies like graphic organizers may have crossover effects in mathematics for students of all ability levels. We found that four corners and a diamond, when properly used, was an extremely useful instructional method in the middle grades mathematics classroom. Our instructional approach helped students construct content knowledge and strategic knowledge and, we contend, it also improved their mathematical communication skills. In addition, four corners and a diamond allowed teachers to quickly identify the weaknesses and strengths of students’ problem solving abilities. As teachers seek to expand and improve students’mathematical knowledge to help them solve problems, they may find that good teaching in reading and writing is good teaching in math.
Extensions The author shows how graphic organizers that are typically used to help students organize their thoughts while writing in ELA can also be used to help them think through problem-solving tasks in mathematics.
How can teachers use graphic organizers to actively engage students in thinking and problem-solving activities in all areas of the curriculum?
Author note I would like to thank the students and teachers of the East Aurora (IL) middle schools, and especially teacher Karen Lopez, for their assistance.
Acknowledgement This work was supported in part by the Illinois Mathematics and Science Partnerships Program/ISBE/US Department of Education, funded by NCLB, Title II, Part B, US DOE.
Ellis, E. (2004). What’s the big deal about graphic organizers? Retrieved July 7, 2003, from http://www.Graphic Organizers.com
Goeden, J. (2002). Using comprehension frames (graphic organizers) to impact students’ reading comprehension . Unpublished thesis. Black Hills State University.
Gould, J., & Gould, E. (1999). Four square writing method for grades 1–3 . Carthage, IL: Teaching and Learning Company.
Illinois State Board of Education. (2005). Mathematics scoring rubric. Springfield, IL: Author.
Illinois State Board of Education. (1997). Illinois learning standards . Springfield, IL: Author.
Lester, F. (Ed.). (2007). Second handbook of research on mathematics teaching and learning . Greenwich, CT: Information Age.
Mid-continent Research for Education and Learning (McREL). (2002). ED thoughts: What we know about mathematics teaching and learning . Aurora, CO: Author.
U.S. Department of Education Institute of Educational Sciences. (2007). The nation ‘s report card . Retrieved January 28, 2008, from http://nces.ed.gov/nationsreportcard
National Council of Teachers of Mathematics. (1989). Curriculum and evaluation standards for school mathematics . Reston, VA: Author.
National Council of Teachers of Mathematics. (1995). Assessment standards for school mathematics . Reston, VA: Author.
National Council of Teachers of Mathematics. (2000). Principles and standards for school mathematics . Reston, VA: Author.
National Reading Panel. (2000). Teaching children to read: An evidence-based assessment of the scientific research literature on reading and its implications for reading instruction . Washington DC: U.S. Department of Health and Human Services.
National Research Council. (2002). Learning and understanding: Improving advanced study of mathematics and science in U.S. high schools . Washington DC: National Academy Press.
Polya, G. (1944). How to solve it . Garden City, NY: Doubleday.
Trends in International Mathematics and Science Study (TIMSS). (2003). Trends in international mathematics and science study . Washington, DC: International Association for the Evaluation of Educational Achievement.
Zollman, A. (2006a, April). Four-corners is better than Four-squares: Assessment connection for solving mathematics story problems. Presented at the Annual Conference of the National Council of Teachers of Mathematics, St. Louis, MO.
Zollman, A. (2006b, October). Write is right: Improving students’ problem solving using graphic organizers. Presented at the 105th Annual Convention of the School Science and Mathematics Association, Missoula, MT.
Alan Zollman is an associate professor of mathematics education in the department of mathematical sciences at Northern Illinois University, DeKalb. E-mail: [email protected]
Published in Middle School Journal , November 2009.
Copyright © 2009, Association for Middle Level Education

Privacy Overview
Math Graphic Organizers
Explain math concepts effectively, simplify complex mathematical problems and describe concepts graphically in an easily consumable manner..
- Customizable templates to organize math concepts and solve problems
- In-app video conferencing to facilitate teaching in a remote environment
- JPEG, PNG, & PDF exports to print and distribute physical copies

Present Math Concepts Visually
Multiple math graphic organizer templates to help you start explaining math concepts quickly.
Smart formatting and preset color themes to highlight, color-code, and differentiate concepts on the math graphic organizer.
Import or drag and drop images and icons to the canvas or use built-in Google image search to browse the internet for graphics to further customize your graphic organizers.
Built-in tools to instantly arrange visuals and information on the canvas and create interactive presentations and graphic organizers for teaching.
Over 50 types of diagrams to visualize, analyze, classify, and organize information; Euler diagrams, Venn diagrams, KWL charts, concept maps, storyboards, and more.
Centralize All Learning Resources

Insert documents and assets with in-app previews to provide more context to the graphic organizers and create resourceful instructional material.
Embed your graphic organizers in any site , or in Google docs, sheets, or slides, and Powerpoint presentations.
Export your math graphic organizers as SVGs, PDFs, and PNGs to publish, present, print, and share.
Infinite canvas that scales up to 1000s of items in a single view to create a central repository of resources, learning material, instructions, and assignments.

Collaborate with Students Remotely
Interactive online whiteboard with freehand drawing to conduct collaborative brainstorming sessions and facilitate classroom discussions.
Video conferencing baked into the platform to feel like you are in the same classroom while engaging with students.
Real-time cursors for any number of participants . Collaborate with students on a shared canvas during lessons.
Comment with context . Full comment threads and discussions for async collaboration to streamline giving students feedback or obtaining feedback from them.
Multiple access and role levels to streamline sharing, reviewing, and editing graphic organizers with students, parents, or colleagues.

What Is a Math Graphic Organizer?
Math graphic organizers are used to describe math concepts graphically to students. It helps with simplifying and solving complex math problems.
How to Create a Math Graphic Organizer?
- Select the math problem you want to identify and a relevant graphic organizer that you can use to solve it. For example, you can use a Venn diagram template.
- If you want to get a quick start, use Creately math graphic organizer templates, or you can start from scratch.
- Invite your students or colleagues to collaborate as you wish. You can send them either a Review diagram or Edit diagram link. Any changes they make will be applied to the diagram in real-time.
- Personalize your math graphic organizers with Creately color schemes. You can also import images or find them with the built in image search option.
- If you wish to take print-outs, export your diagram as a PDF or an image. You can also add them to your PowerPoint presentations and Word docs.
- The Creately Viewer is a handy way to embed your math graphic organizers in a website or your blog. This will display an always updated diagram and give quick access to students.

- Post published: September 25, 2020
- Post category: Blog / Math
Do your students struggle to show and explain their thinking when solving word problems? This problem solving graphic organizer will give your students a structured way to do just that.
So many students equate being successful in math with being able to solve a problem the fastest. The kids who put their hands up first are the best at math. That’s what they think but it’s not true. We need to let our students know that it’s okay to slow down; that we want them to think deeply about mathematical concepts and struggle through.
So, how do you get them to slow down? You make them use this tool. But honestly, they aren’t going to want to do it.

Step 1: Use a problem solving graphic organizer
This is the graphic organizer is what we use. Try it with your class and watch the magic happen . You can get a free version of the problem solving organizer here . But first, make sure you read this post all about how to introduce problem solving to your students. Here’s the breakdown:
Box 1: Understand – students restate the problem in their own words and list what they know from the problem and what they need to know.
Box 2: Strategize – students make a plan and list strategies that they think they might use to solve the problem before they actually start solving it.
Box 3: Solve – students carry out their plan here, making adjustments as necessary.
Box 4: Reflect – students explain what they did and why and also reflect on why their solution makes sense.

Step 2: Model how to use it
Here’s my biggest takeaway from the past few years:
Until I know what my students know I need to assume that they don’t know what I assume they should know.
Does that make sense?
I don’t think you should always model math concepts first but in this case I wanted to explicitly teach the problem solving process and I wanted them to do it my way.
The strategies that they use to solve the problem – that’s all them – but my students needed this scaffold until they internalized the process.
1. Explain to your students that mathematicians use an organized process to record their thinking when solving problems and that today they are going to learn how to use a problem solving graphic organizer.
This will help them to organize their thinking in a way that will make it easier for others to understand and will help them to slow down and think deeply about the problem that they are required to solve.
2. Post a problem on the board. Here’s the one I used:

3. Use the graphic organizer and model how you would solve this problem. Your students may want to jump in at this point and help solve it, which is great, but encourage them to just listen and absorb. They will get a chance to practice soon!
4. Have students think-pair-share what they noticed you doing and why they thought you did it.
Step 3: Have students work in groups using the graphic organizer
1. Post another problem on the board. If you are looking for some open-ended problems for groups you can check out my product here .

2. Split students up into groups of four and give them the first box of the problem solving graphic organizer. I would enlarge this onto 11×14 paper so that group members can see and to facilitate sharing later on.
I purposely only give one box at a time, otherwise the students want to race ahead to the solving part. Have students complete Box 1 and then meet with another group to share.
3. Put up a blank version of the problem solving graphic organizer and fill in Box 1 together. Then pass out Box 2 and repeat the process until all four boxes have been completed.
Step 4: Have students use the problem solving graphic organizer independently
Now it is Independent Practice time. Post three problems on the board. An example is included with the problem solving graphic organizer freebie.
Explain that the problems are of varying levels of difficulty and they can choose to complete any one of the three.

This lesson may take more than one class period but it is so worth it to take the time to teach your students how to use a problem solving graphic organizer properly. You are setting them up for success and helping to change their mindset about math. You are doing big things!
Looking for more great tips? Sign up for the Middle School Mashup Email Club below to get some more ideas in your inbox every week!

You Might Also Like

The Building Thinking Classrooms Approach – 5 Reasons to Try It

Distance Learning Math Lessons: A 5 Part Structure

How to Run a Kindness Challenge with your Students
Math Graphic Organizers

3 Circle Venn Diagram Template
This 3 circle venn diagram template is the perfect tool to help you or your students unlock the power of visual organization. Download this free PDF template to get started organizing key concepts.

Prime Factorization Graphic Organizer
I created this prime factorization graphic organizer for my Algebra 1 students to summarize two different methods for finding prime factorization: the factor tree method and the birthday cake method. I teach my Algebra 1 students to simplify radicals through prime factorization because it works no matter what the index of the radical is. This …

Adding and Subtracting Polynomials Graphic Organizer
I created this adding and subtracting polynomials graphic organizer for my Algebra 1 students to glue in their interactive notebooks. Free Download of Adding and Subtracting Polynomials Graphic Organizer

Solving Systems by Elimination Graphic Organizer
I created this solving systems by elimination graphic organizer for my Algebra 1 students to use and glue in their interactive notebooks. These are very similar to the graphic organizer I made for solving systems by substitution. We did substitution first and elimination afterwards. My students, like usual, much preferred the elimination method. When I …

Solving Systems by Substitution Graphic Organizer
I created this solving systems by substitution graphic organizer for my Algebra 1 students to use in their interactive notebooks. This graphic organizer walks students through the steps of solving a system of equations by substitution. Here’s a closer look at the word problems we tackled for substitution. We ended up solving four different word …

Four Types of Slope Graphic Organizer
I created this four types of slope graphic organizer for my Algebra 1 students to glue in their interactive notebooks. Though the concept of slope is a middle school standard in Oklahoma, I find that I have to go ALL the way back to the basics with my Algebra 1 students. We began by refreshing …

Writing Linear Equations Graphic Organizer
I created this set of writing linear equations graphic organizers to give my Algebra 1 students practice writing linear equations given a graph, intercepts, a set of points, or a point and a slope. Students are given several pieces of information, and they have to figure out every single other piece of information. I love …

Graphing Linear Inequalities Foldable
Yesterday, we started exploring the idea of graphing linear inequalities. We’ve been graphing linear equations for a month now, so it was time to branch out a bit. I created a graphing two variable inequalities dry erase template for my 11 x 17 dry erase pockets to help students understand what it means for a point …

Rate of Change Graphic Organizer and Practice Problems
I added a new rate of change graphic organizer this year in our Algebra 1 interactive notebooks. This graphic organizer resulted from making the decision to NOT introduce the term “slope” during our relations and functions unit. Instead, I decided to wait until our linear graphs and inequalities unit to begin referring to rate of …
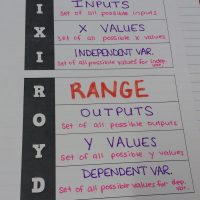
Domain and Range Graphic Organizer DIXI ROYD
I took my trusty DIXI ROYD mnemonic and turned it into a domain and range graphic organizer for my Algebra 1 students to glue in their interactive notebooks. Free Download of Domain and Range Graphic Organizer DIXI ROYD

Types of Sequences Graphic Organizer
I created this types of sequences graphic organizer for my Algebra 1 students to glue in their interactive notebooks. Even though Oklahoma’s standards only mention arithmetic and geometry sequences, I decided to include a category called “Neither” as well. This gave me the opportunity to expose my students to the Fibonacci sequence! In retrospect, I …
The Frayer Model for Math
ThoughtCo. / Deb Russell
- Math Tutorials
- Pre Algebra & Algebra
- Exponential Decay
- Worksheets By Grade
The Frayer Model is a graphic organizer that was traditionally used for language concepts, specifically to enhance the development of vocabulary. However, graphic organizers are great tools to support thinking through problems in math . When given a specific problem, we need to use the following process to guide our thinking which is usually a four-step process:
- What is being asked? Do I understand the question?
- What strategies might I use?
- How will I solve the problem?
- What is my answer? How do I know? Did I fully answer the question?
Learning to Use the Frayer Model in Math
These 4 steps are then applied to the Frayer model template ( print the PDF ) to guide the problem-solving process and develop an effective way of thinking. When the graphic organizer is used consistently and frequently, over time, there will be a definite improvement in the process of solving problems in math. Students who were afraid to take risks will develop confidence in approaching the solving of math problems.
Let's take a very basic problem to show what the thinking process would be for using the Frayer Model.
Sample Problem and Solution
A clown was carrying a bunch of balloons. The wind came along and blew away 7 of them and now he only has 9 balloons left. How many balloons did the clown begin with?
Using the Frayer Model to Solve the Problem:
- Understand : I need to find out how many balloons the clown had before the wind blew them away.
- Plan: I could draw a picture of how many balloons he has and how many balloons the wind blew away.
- Solve: The drawing would show all of the balloons, the child may also come up with the number sentence as well.
- Check : Re-read the question and put the answer in written format.
Although this problem is a basic problem, the unknown is at the beginning of the problem which often stumps young learners. As learners become comfortable with using a graphic organizer like a 4 block method or the Frayer Model which is modified for math, the ultimate result is improved problem-solving skills. The Frayer Model also follows the steps to solving problems in math.
- Graphic Organizers in Math
- Math Word Problems for Third Graders
- Examples of Problem Solving with 4 Block
- 2nd Grade Math Word Problems
- Problem Solving in Mathematics
- How to Use Math Journals in Class
- Algebra: Using Mathematical Symbols
- Sixth Grade Word Problems
- 7 Steps to Math Success
- The Horse Problem: A Math Challenge
- Quiz 8th-Graders With These Math Word Problems
- Second Grade Math: Solving Word Problems
- Math Stumper: Use Two Squares to Make Separate Pens for Nine Pigs
- Solving Problems Involving Distance, Rate, and Time
- Realistic Math Problems Help 6th-graders Solve Real-Life Questions
- Lesson Plan Step #8 - Assessment and Follow-Up
All Formats
Resource types, all resource types.
- Rating Count
- Price (Ascending)
- Price (Descending)
- Most Recent
Free math graphic organizers

Math in the Movies - NOW INCLUDES GOOGLE SLIDES FOR DISTANCE LEARNING!

Spring Math Activity Insects Butterflies Symmetry Ladybug Butterfly Math Centers

Personal Finance Unit - PBL Simulation - Print and Google™ Drive

Algebra 1 Guided Notes, Presentation, and Interactive Notebook Bundle

FREE Hundreds Chart Printables: 100 and 120

Free Sub Plans Mini Lessons | FREE Emergency Substitute Plans

Free Sea Turtle Mystery Picture (120 Chart & Multiplication)

Coin Cut and Paste, Match and Identify Quarter, Dime, Nickel, Penny

Converting Fractions, Decimals, and Percents Guided Notes Doodle Math Wheel
Quadrilateral Theorems and Classifying Quadrilaterals Anchor Chart / Poster
Boho Rainbow Daily Agenda and Subject Google Slides FREEBIE
- Google Slides™

Free Grid Paper Templates
FREE Exponents Doodle Notes

Addition and Subtraction Practice within 5 and 10
Weather Chart and Graph FREEBIE!

FREE Days of the week wheel

Blank Tens Frames

Free Outer Space Color By Code K-2

Exponent Rules Graphic Organizer
Curriculum Organization Guide and FREE sample
Open Number Line Template Free

FREE Measurement: Sort by Weight
Volume and Surface Area Formula Cheat Sheet

Perimeter Area and Volume Formulas

FREE Cartesian Coordinate Plane Graph Paper Templates (Personal use only)
Free Easter Activity Packet with Reading, Math, and Grammar

Ratios and Proportions - Math Guided Notes/Interactive Notes

Measurement Posters | Customary and Metric

Find Math resources | TPT
Importance of learning math skills.
It's no secret that mathematics is one of the foundational subjects that students need to learn. Math forms the basis for so many other subjects — like science, engineering, and technology — and because of that, it's essential that students develop strong math skills starting from a very young age.
Benefits of learning math
Learning math has many benefits. It helps students:
- Begin to develop problem-solving, logical reasoning, and critical-thinking skills
- Grow their understanding of numbers and basic operations
- Understand how math is used in real-life situations
By ensuring that students have a solid foundation, teachers can help set them up for future success.
Discover printable and digital math resources
Math resources are an integral part of effective math education. On TPT, math resources come in various forms: from worksheets and full-year curricula to manipulatives and educational games. They can be used to enhance learning, assess student’s mastery of math concepts, and engage students in meaningful learning. By incorporating math resources from TPT into your teaching toolbox, you can create a rich learning experience that strengthens students’ understanding of math concepts and encourages a positive attitude toward math.
If you’re a teacher or parent looking for printable and digital math worksheets, TPT has an extensive collection of math resources across topics and grade levels. No matter what math topic your students are working on — whether you’re teaching numbers to kindergarteners or algebra to 9th graders — TPT has resources designed to help with any math learning need.
With a little encouragement and plenty of resources, TPT resources can make teaching and learning math so much easier. Plus, you can expand students’ knowledge even further by exploring TPT science resources, which are frequently paired with math lessons.
Frequently asked questions about math resources
What types of math lessons are available on tpt.
There are many different types of math resources sold by Sellers on TPT. Some popular math lessons include geometry, mental math, algebra, fractions, place value, measurement, and decimals.
How do I find math lessons on TPT?
Educators can save time preparing math lessons with resources created by experienced teachers. Simply start a search for math resources on the TPT marketplace, and filter by grade level, price, and/or resource type to find materials that've been proven to work in classrooms like yours. No matter what you’re teaching, there are plenty of math lessons and activities sold by Sellers on TPT that are tailored to meet your students' skill levels.
How do I support students struggling with math?
If your student or child is struggling with a specific math concept, you can provide extra support and resources such as math worksheets. Sometimes, visual aids like charts, graphs, and manipulatives can help children understand abstract concepts better.
How can I make math fun?
Students learn best when they're engaged! Sprinkle a little fun into your math lessons by using educational games, videos, puzzles, and real-life scenarios. If your class seems to find math boring or uninteresting, you can also try connecting lessons to their interests or hobbies. Encourage them to ask questions and explore mathematical concepts in different ways.
- We're hiring
- Help & FAQ
- Privacy policy
- Student privacy
- Terms of service
- Tell us what you think
- Try for free
8th Grade Mathematics Graphic Organizers
- Most Popular
- Most Recent

IMAGES
VIDEO
COMMENTS
Download. Break it down PDF - 59.5 KB. Download. If your child has trouble with math, a graphic organizer can help. Graphic organizers help kids break down math problems into steps. They're great tools for figuring out what's being asked in a word problem or which operation to use. Kids can also use them to learn new math concepts.
Four operations graphic organizer. When solving large number equations, such as 3-digit by 2-digit multiplication, or adding 4-digit by 3-digit numbers, many students have trouble with lining up the numbers properly. Using these grids, students ensure there is one number per box and that they solve each row by their place values (ones, tens ...
How Graphic Organizers Work for Math. A typical graphic organizer has the problem printed on it. The paper is divided into four quadrants with the problem appearing at the top, although sometimes, it can be found in the middle of the page. The first quadrant is used for the student to determine what the problem is actually trying to solve for.
Graphic organizers are commonly used in the math classroom to help students represent and understand information that they're working with, and to guide them through the process of solving mathematical problems. A great deal of math instruction is communicated visually, in charts and graphs and diagrams. For kids, who are visual learners by ...
Graphic organizers allow, and often require, the student to sort information and classify it as essential or non-essential; structure information and concepts; identify relationships between concepts; and organize communication about an issue or problem. Consider the middle grades math problem in Example 1 from a recent state assessment.
Graphic Organizers increase learning. As a tool to support students' thinking and learning processes, the 29 research studies have shown that graphic organizers help students: brainstorm ideas. develop, organize, and communicate ideas. see connections, patterns, and relationships. assess and share prior knowledge. develop vocabulary.
It helps with simplifying and solving complex math problems. How to Create a Math Graphic Organizer? Select the math problem you want to identify and a relevant graphic organizer that you can use to solve it. For example, you can use a Venn diagram template. If you want to get a quick start, use Creately math graphic organizer templates, or you ...
12-Digit Place-Value Charts. Help your students develop their number math skills using this 12-digit place value chart resource which extends to the billions. This printable can be used to teach counting, place value, as well as, other math concepts. Incorporate into your lesson or use for practice at home. 26-Digit Place-Value Charts.
Writing Linear Equations Graphic Organizer. I created this set of writing linear equations graphic organizers to give my Algebra 1 students practice writing linear equations given a graph, intercepts, a set of points, or a point and a slope. Students are given several pieces of information, and they have to figure out every single other piece ...
Put up a blank version of the problem solving graphic organizer and fill in Box 1 together. Then pass out Box 2 and repeat the process until all four boxes have been completed. Step 4: Have students use the problem solving graphic organizer independently
I created this solving systems by substitution graphic organizer for my Algebra 1 students to use in their interactive notebooks. This graphic organizer walks students through the steps of solving a system of equations by substitution. Here's a closer look at the word problems we tackled for substitution. We ended up solving four different ...
The Organizer Teacher. This is a free SAMPLE for my set of 30 one-step and two-step word problem sets from January. Each word problem comes with a graphic organizer. I have included a page of key words to help students remember how to identify the operation in a multi-step problem. The graphic organizer helps students to identify what operation ...
4 Block Math Problem Solving. D. Russell. Print the 4 Block Math Template in PDF. In this article I explain how to use this graphic organizer in math which is sometimes referred to as: 4 corners, 4 block or 4 square.. This template works well for solving problems in math that require more than one step or with problems that could be solved by using different strategies.
Loving Math 143. 4.6. (11) $3.00. PDF. UPS Check - Math Graphic Organizer for solving word problemsThis resource is a great graphic organizer to help students break down math word problems. This graphic organizer includes four steps to take when solving a math word problem.
Learning to Use the Frayer Model in Math. These 4 steps are then applied to the Frayer model template ( print the PDF) to guide the problem-solving process and develop an effective way of thinking. When the graphic organizer is used consistently and frequently, over time, there will be a definite improvement in the process of solving problems ...
A math wheel is a type of graphic organizer where students can:Take notes inside the math wheelUse color, drawing, and doodling to help create memory triggersComplete practice problems in the pattern around the wheel, andColor the background patternStudents. Subjects: Decimals, Fractions, Math. Grades:
A graphic organizer can be a quick and easy solution to help students develop a process for problem-solving. This organizer is based on George Polya's 4-Step problem solving process. Polya was a Hungarian mathematician who discovered that any mathematical problem could be solved in 4-steps: Understand, Plan, Solve, and Reflect.
Word problem organizer Author: K5 Learning Subject: Math problem solving strategy Keywords: Step by step help for solving word problems, math graphic organizer, break down math word problems Created Date: 2/6/2021 1:59:08 PM
Blank Graphic Organizer. This printable sheet has a ready-to-use bubble diagram for organization. This graphic organizer can be used in every…. Browse our printable 8th Grade Mathematics Graphic Organizers resources for your classroom. Download free today!
This paper describes graphic organizers and their potential mathematics benefits for both students and teachers; elucidates a specific graphic organizer adaptation for mathematical problem solving ...
A Graphic Organizer for Problem Solving - National Council of Teachers of Mathematics. Classroom Resources. Publications. Standards & Positions. Advocacy. Research. Conferences & Professional Development.
newfound importance of problem solving as a crucial part of the mathematics curriculum. In today's mathematics classroom, problem solving should play an important role in how students learn and explore new mathematical concepts. Problem solving requires students to apply the skills they have learned to different real-life situations (Cai, 2013).
Improving students' problem-solving abilities is a major, if not the major, goal of middle grades mathematics. To address this goal, the author, who is a university mathematics educator, and nine inner-city middle school teachers developed a math/science action research project. This article describes their unique approach to mathematical problem solving derived from research on reading and ...